
The search interface
The Search page is where you'll spend most of your time. This page tours its controls and the day-to-day workflow.
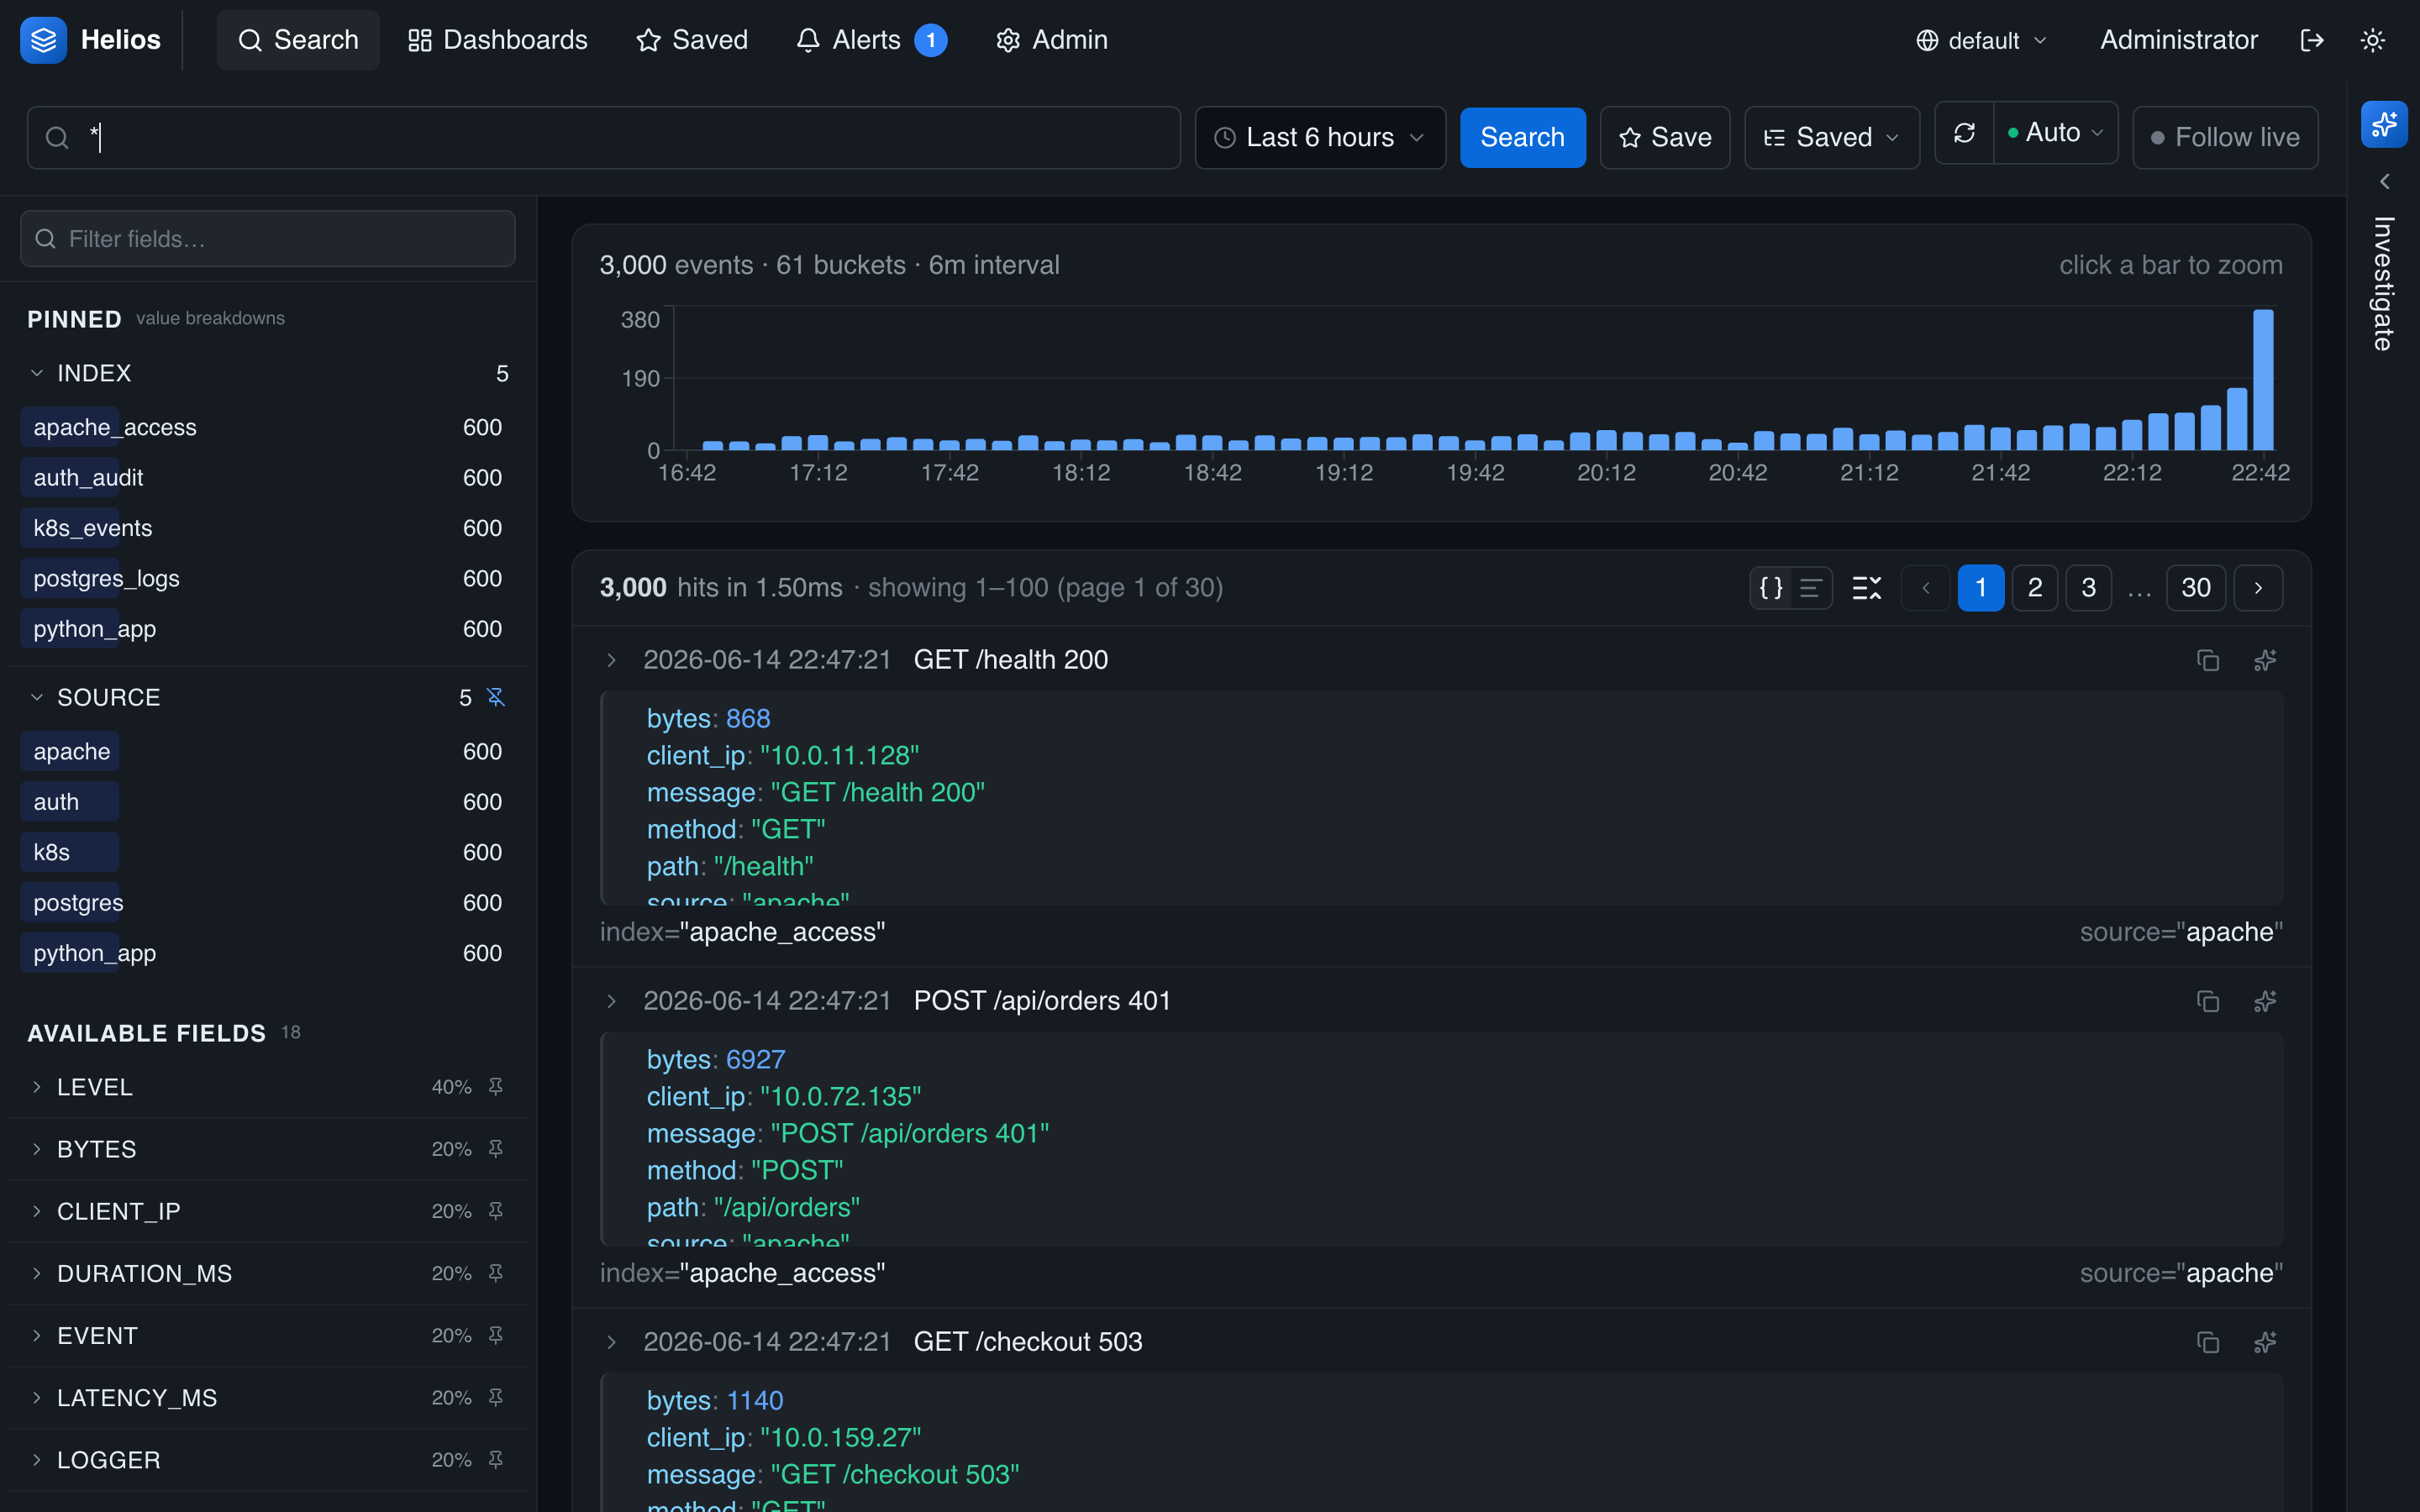
Anatomy
- Search bar (top) — type a query; autocomplete suggests fields, values, operators, and pipe stages as you type.
- Time range picker — choose the window to search.
- Refresh control — run now, or auto-refresh on an interval.
- Histogram — event counts over time for the current query.
- Field panel (left) — fields discovered in the results, with value breakdowns.
- Results (center) — the matching events, or a table/chart for piped queries.
- Investigate drawer (right) — the AI agent.
Searching
Type a query and run it. The autocomplete popover offers context-aware suggestions — field names, known values for a field (scoped to the current time range), boolean operators, and pipe operators. Use the arrow keys to move through suggestions, Enter to accept or run, and Escape to dismiss.
The full query and time range are encoded in the URL, so you can bookmark or share a search and it reopens exactly as you left it.
Choosing a time range
The time picker supports:
- Relative presets — common windows like the last 15 minutes, hour, 24 hours, or 7 days.
- Absolute range — explicit start and end times (shown in your timezone).
- Freeform relative — type a span like
-30m,-2h, or-7d.
Set your display timezone on the Account page; all timestamps across the app follow it.
Auto-refresh
Next to the manual refresh button, pick an auto-refresh interval to keep a query live. Auto-refresh applies to relative ranges (an absolute window doesn't change, so there's nothing to refresh). For a continuously updating view, use Live tail.
The histogram
The histogram shows event counts per time bucket for the current query — a fast way to spot spikes and gaps. Click or drag across it to zoom into a time window, which sets an absolute range. Clear the selection to return to your previous range.
Reading results
For a plain (non-piped) query, results are an event list:
- Each row shows the timestamp (in your timezone), a message preview, and a color-coded severity badge when a level/severity field is present.
- Expand a row to see the full event as a JSON tree or pretty-printed raw text.
- Terms matching your query are highlighted.
- Click a value to add it to the query as a filter (click again to remove it) — the fastest way to drill down.
- Results are paginated; the page size defaults to a sensible value.
For a query with a pipe (| stats, | top, …) results render as a table; | timechart renders as a time-series chart. The header shows row counts, documents scanned, partitions touched, and query time.
The field panel
The left panel lists fields found in your results. Each field shows its top values with counts and a small bar; click a value to filter by it. Pin the fields you care about so they stay at the top, and use the filter box to find a field by name. Before values load, the panel shows each field's coverage, value type, and cardinality. See Fields & discovery.
A typical workflow
- Start broad —
*or a single term — over a recent range. - Watch the histogram; drag to zoom into a spike.
- Click field values (in the panel or in events) to narrow down.
- Switch to an aggregation —
… | stats count by service— to quantify. - Save the search, add it to a dashboard, or hand it to the agent to investigate.