
Building dashboards
Dashboards assemble queries into an at-a-glance view — service health, error rates, latency, traffic — that refreshes on its own. This page covers building, editing, and sharing them; see the Widget reference for each widget type.
Creating a dashboard
From the Dashboards page, click New dashboard to open the editor on an empty grid:
- Add a widget — click Add widget, choose a type, and configure its query and options.
- Arrange — drag widgets and resize them on the 12-column grid.
- Set the time range and an auto-refresh interval (see below).
- Name it and save — give it a name and choose its visibility. A new dashboard stays an unsaved draft until you name it.
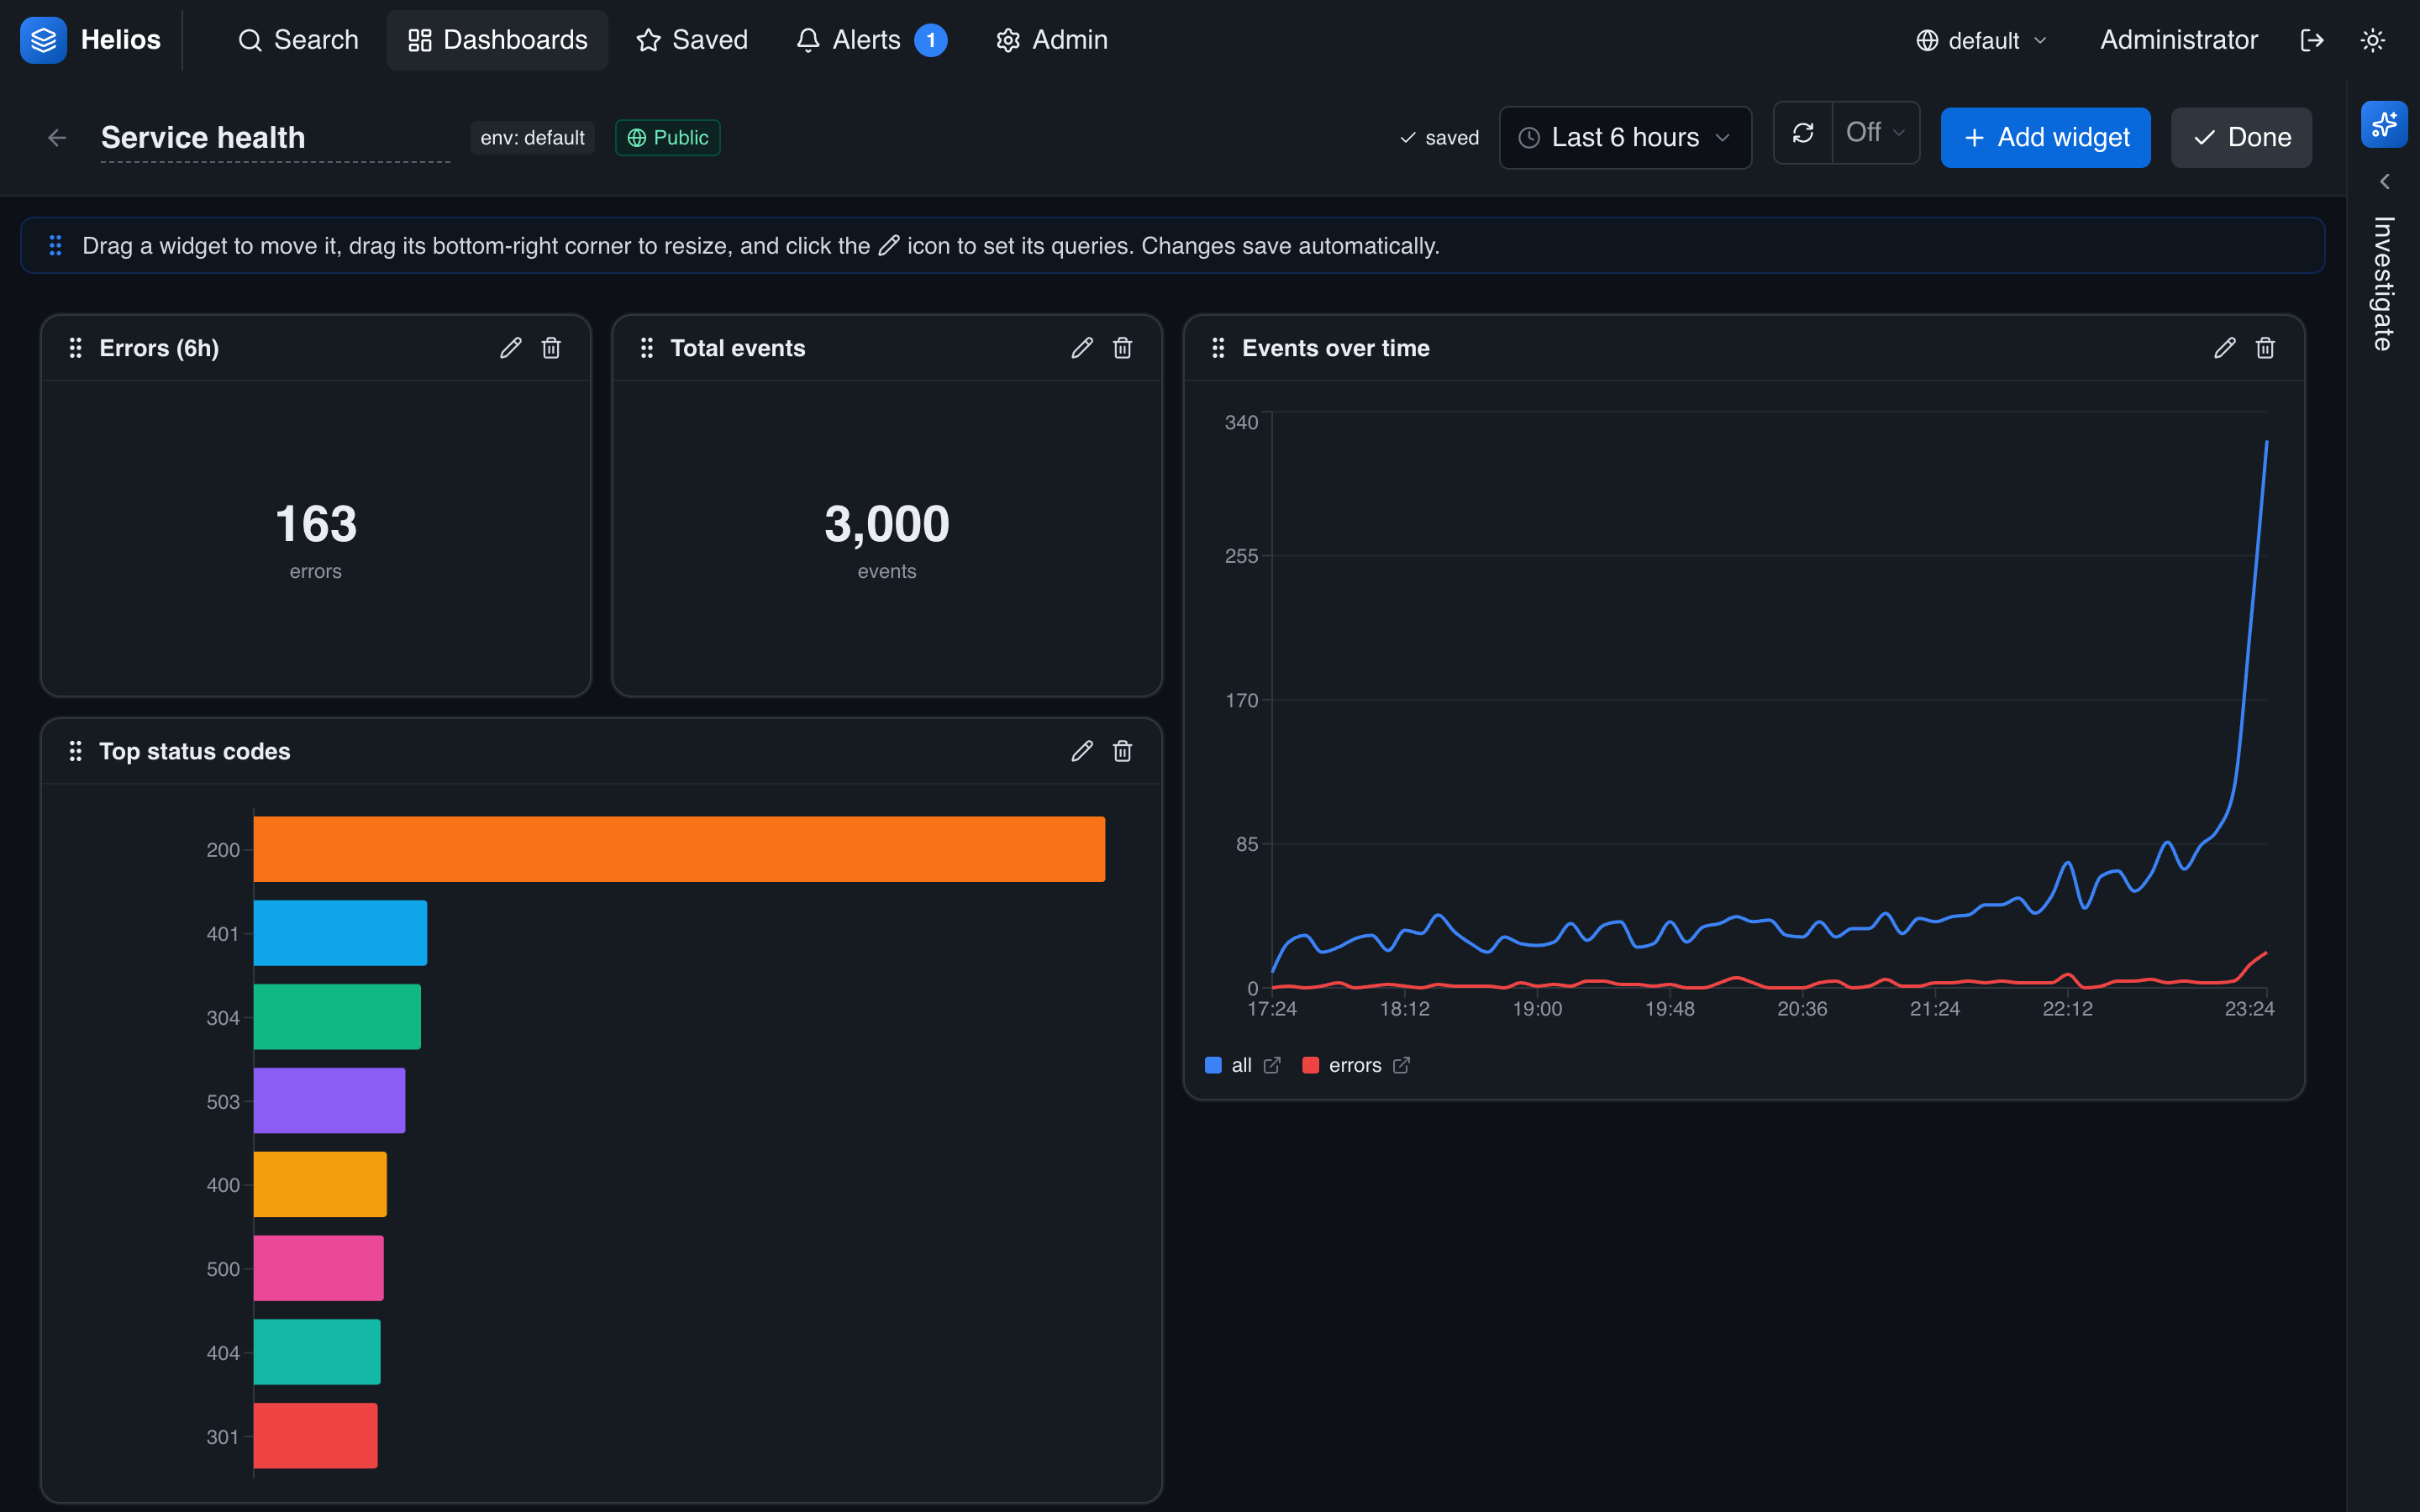
Editing the layout
Open a dashboard and click Edit (or Done to leave edit mode). In edit mode each widget gets a drag handle and inline edit (pencil) and remove (trash) actions, and an Add widget button appears in the toolbar:
- Move — drag a widget by its title bar; others reflow around it.
- Resize — drag the bottom-right corner. The grid is 12 columns wide; widgets snap to it.
- Edit a widget — click its pencil to reopen the widget editor and change its query, type, or options.
- Remove — click the trash icon.
- Add — click Add widget for a new one.
Changes save automatically while you edit an existing dashboard — there's no separate save step. Click Done when you're finished to return to view mode.
Time range & refresh
A dashboard has a default time range (e.g. Last 6 hours) that every widget uses, set from the picker in the toolbar. Individual widgets can override it when one needs a different window — for example a 7-day trend beside 1-hour panels (see per-widget time range).
Next to the range is the refresh control: leave it on Auto (an interval scaled to the range), turn it off, or pick a fixed interval to keep the whole board live. Auto-refresh applies to relative ranges only — pinning an absolute start/end turns it off, and it pauses while you're editing.
Sharing and visibility
Like saved searches, dashboards are either public (visible to everyone) or private (just you). Toggle it with the lock/globe control in the editor toolbar. Public dashboards are read-only for people who aren't the owner.
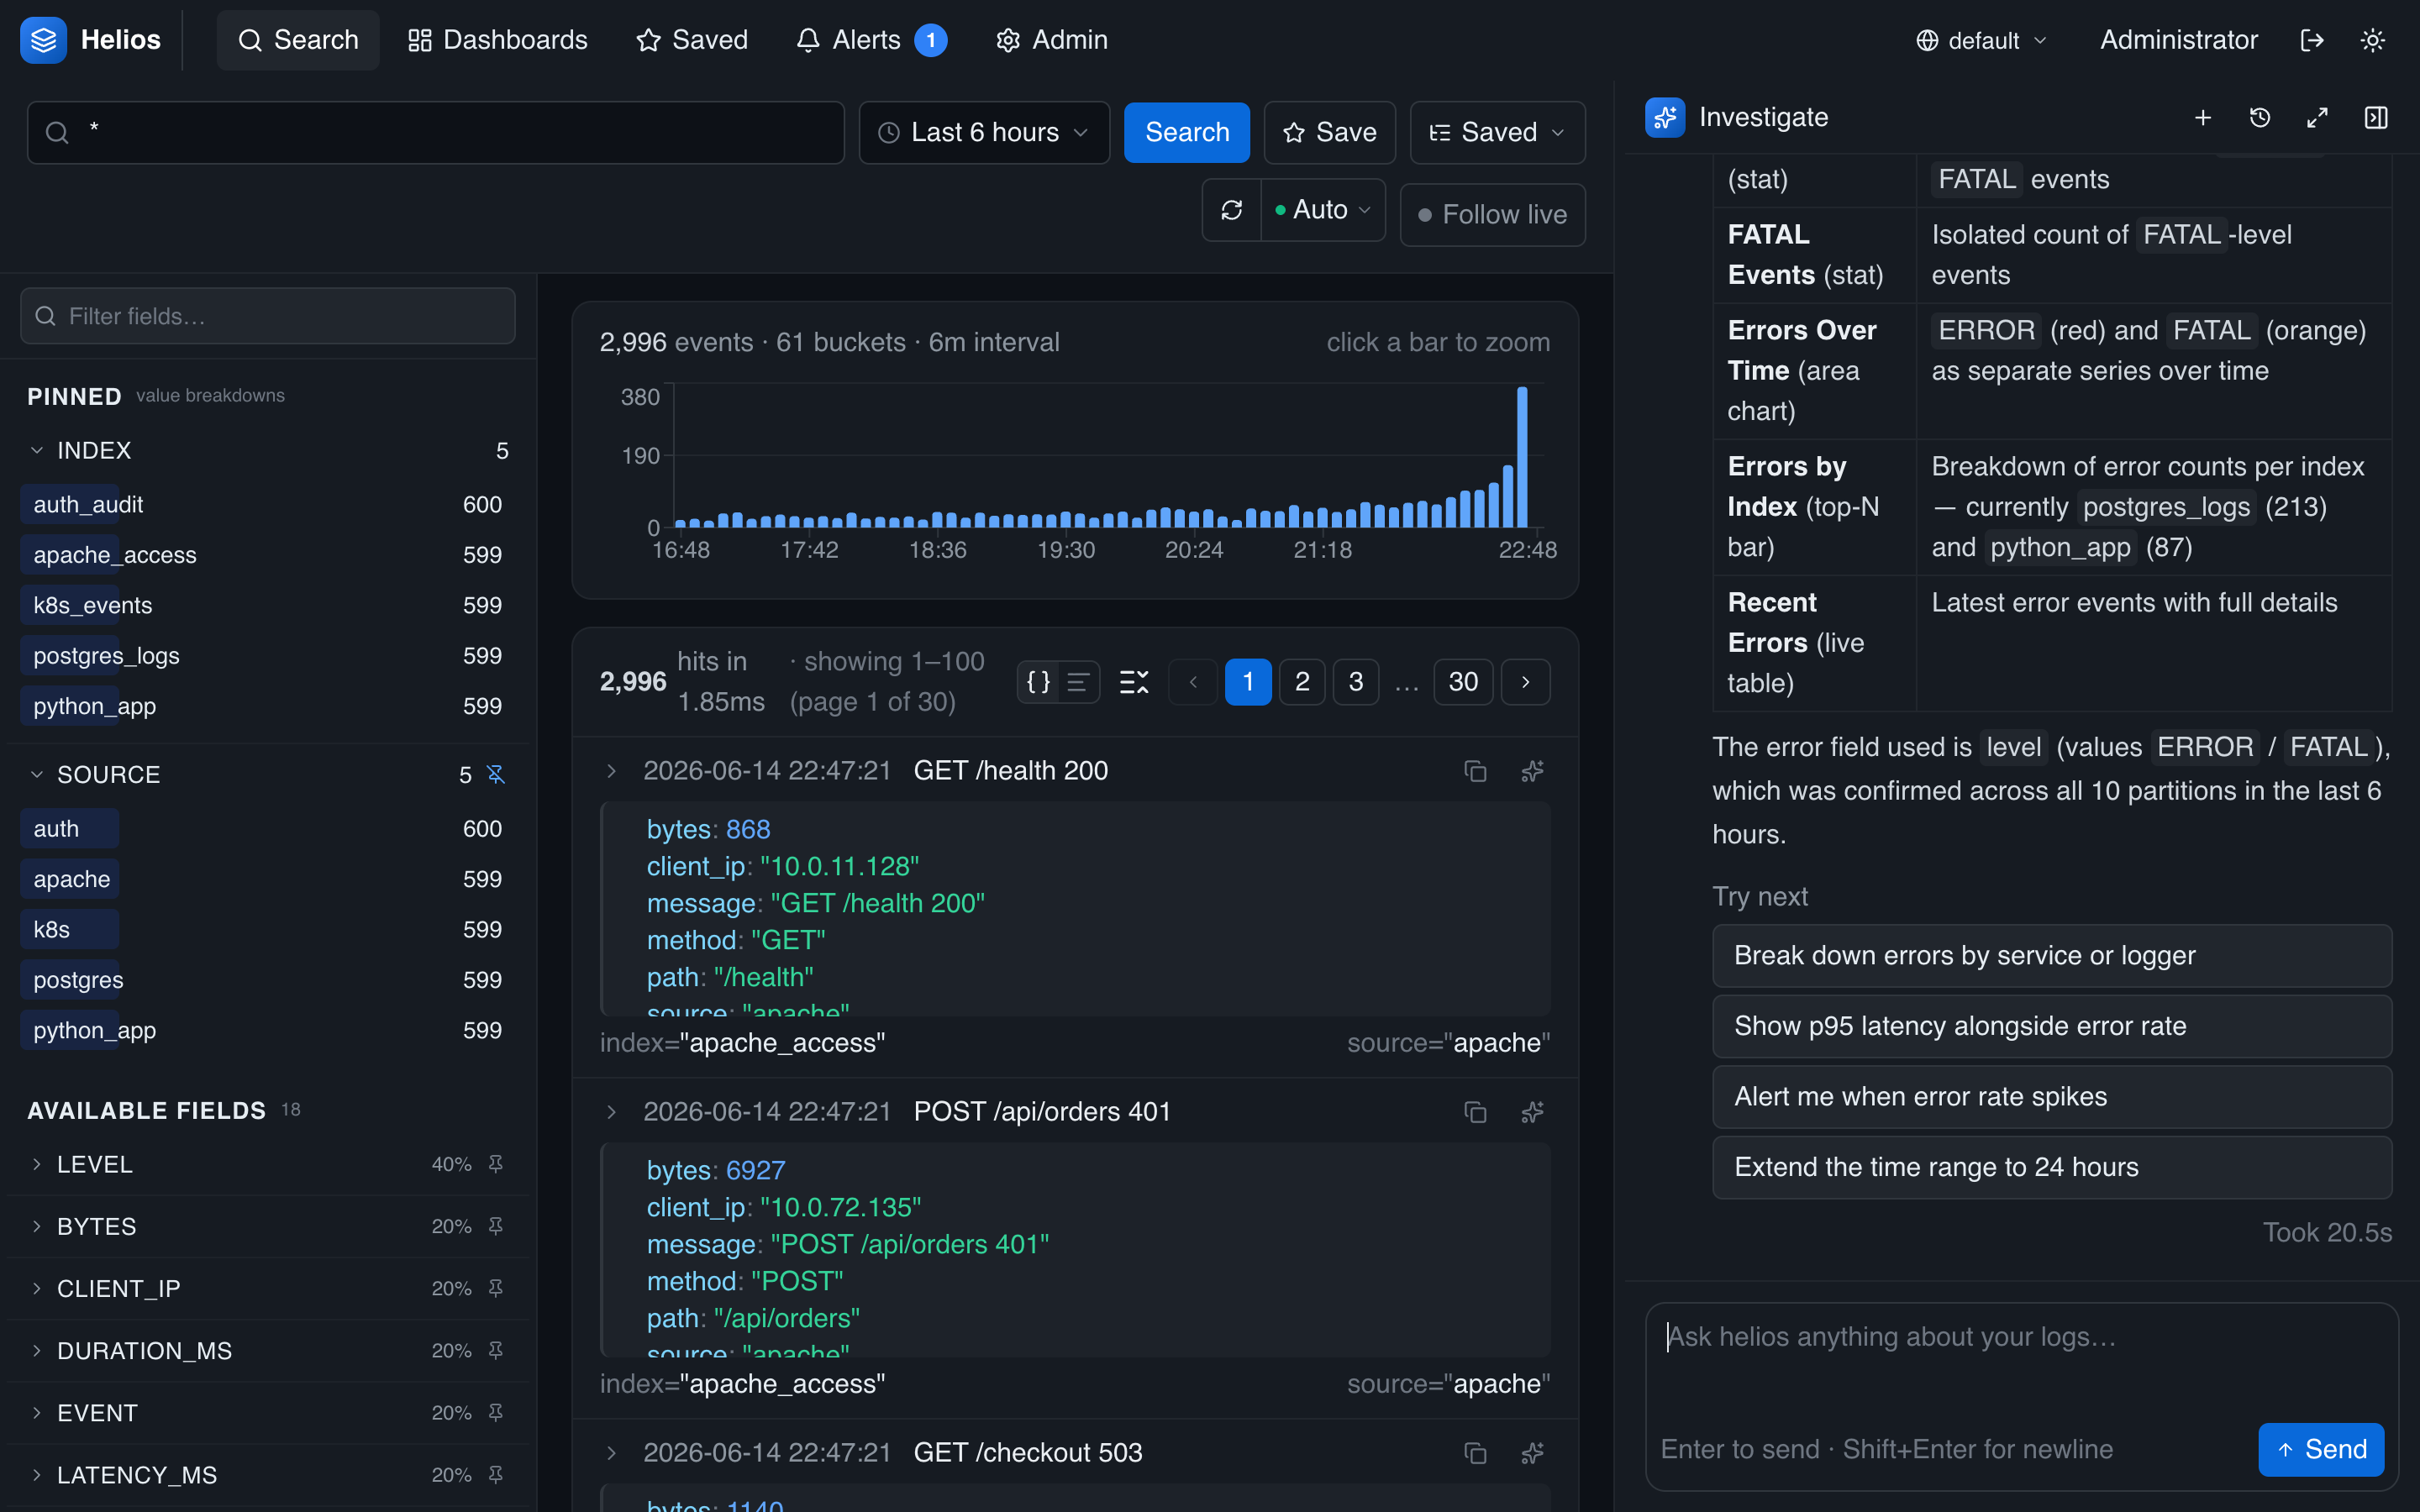
Let the agent build it
You don't have to assemble a dashboard by hand. The AI agent and any MCP client share create_dashboard and update_dashboard tools, so an assistant can build one for you — and, crucially, it can analyze first, then build: investigate your logs with its query/aggregate/histogram tools, work out which series and breakdowns matter, and assemble a dashboard that reflects what it found.
Look at the errors over the last 24 hours, then build a dashboard that tracks them — a time series of error volume, a breakdown by index, and the latest error events.
Dashboards created this way are public and appear in the Dashboards list like any other; open one to edit it further. See Investigating with the agent and the MCP server for details.
Managing dashboards
The Dashboards page lists all dashboards you can see, with a filter box and each one's owner, visibility, and widget count. Open one to view it, or open it in edit mode to change it. Admins can use a "view all" toggle to manage everyone's dashboards.
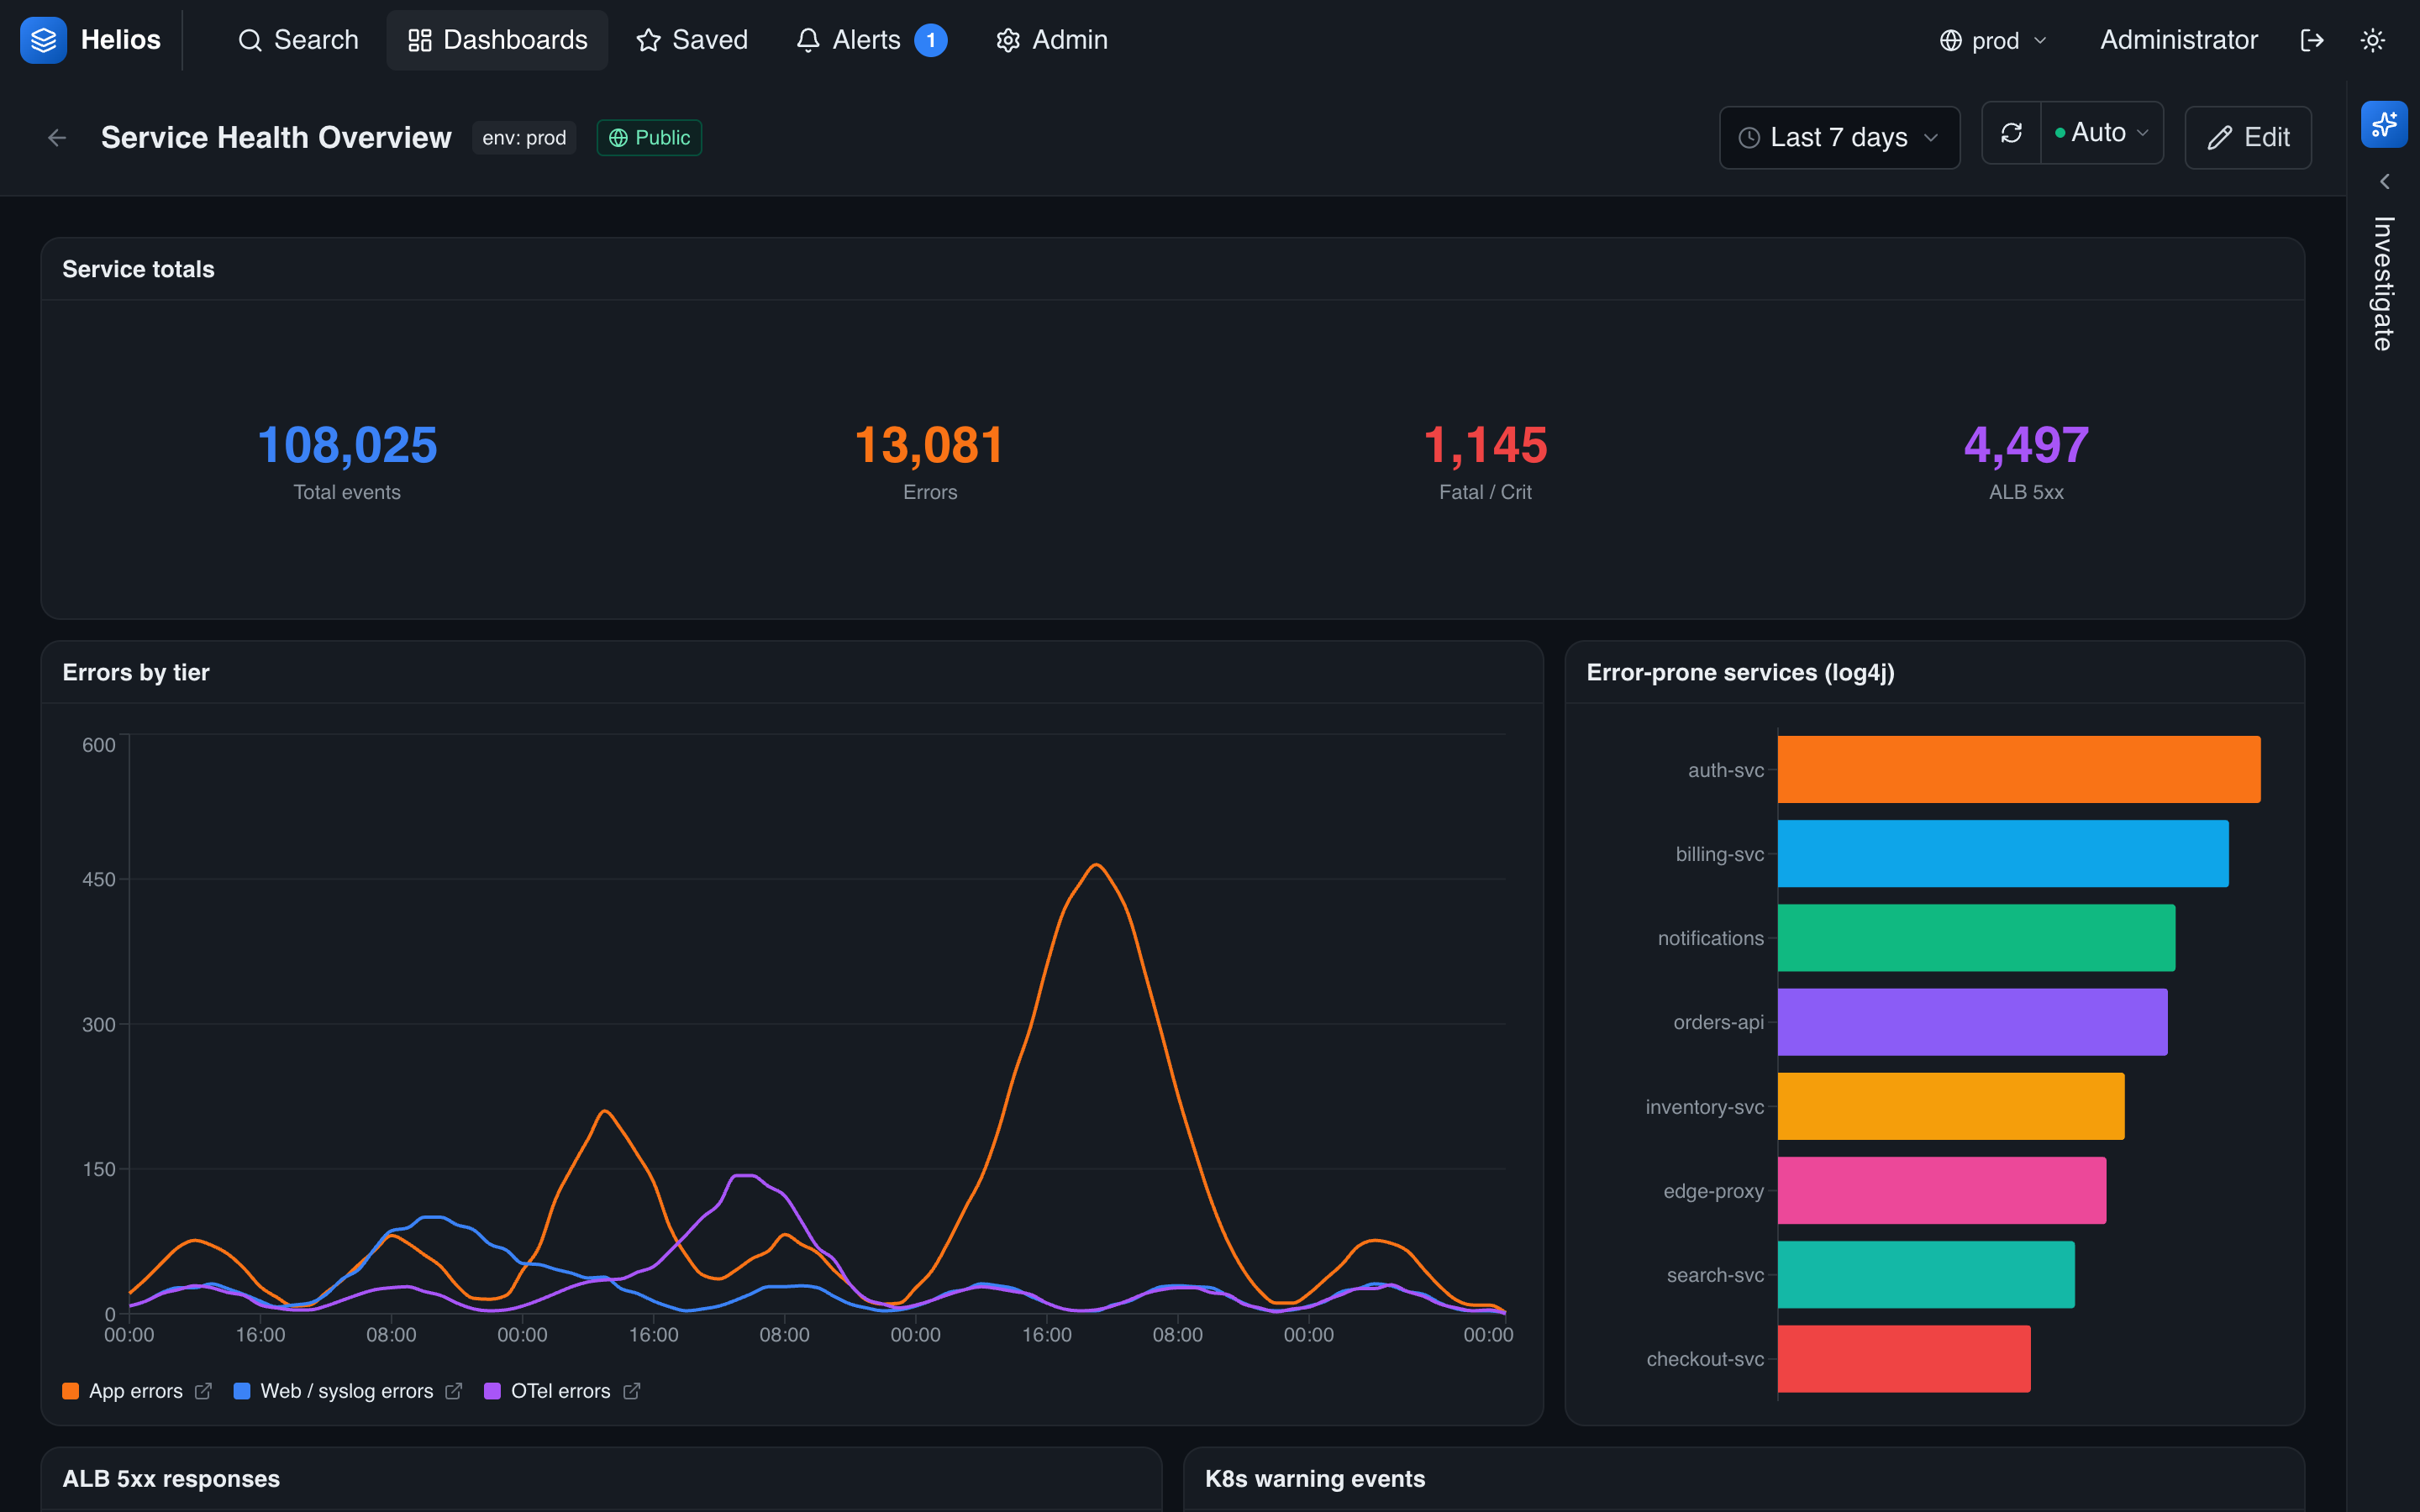
A worked example: service health
A useful first dashboard for an SRE:
- Stat — total errors in the last hour:
level:error. - Time series — request volume over time:
*(add anerrorsseries forlevel:error). - Time series — p95 latency:
* | timechart span=5m p95(latency_ms) by service. - Top values — top status codes: field
statusover*. - Search results — the latest errors:
level:error. - Alerts — your fired alerts inbox.
Set the dashboard range to "last 1 hour," save it as public, and pin it for your team.
Dashboards are environment-aware
Widgets query the active environment. Switch environments with the top-nav picker to point the same dashboard at, say, staging versus production.