
Self-observability
HeliosLogs indexes its own activity back into itself, so you can monitor and debug HeliosLogs with the same search UI you use for application logs. This data lives in the reserved _system environment and is admin-only.
The self-log indexes
| Index | Contents |
|---|---|
_helioslogs | Internal tracing events (info / warn / error) from HeliosLogs's components. |
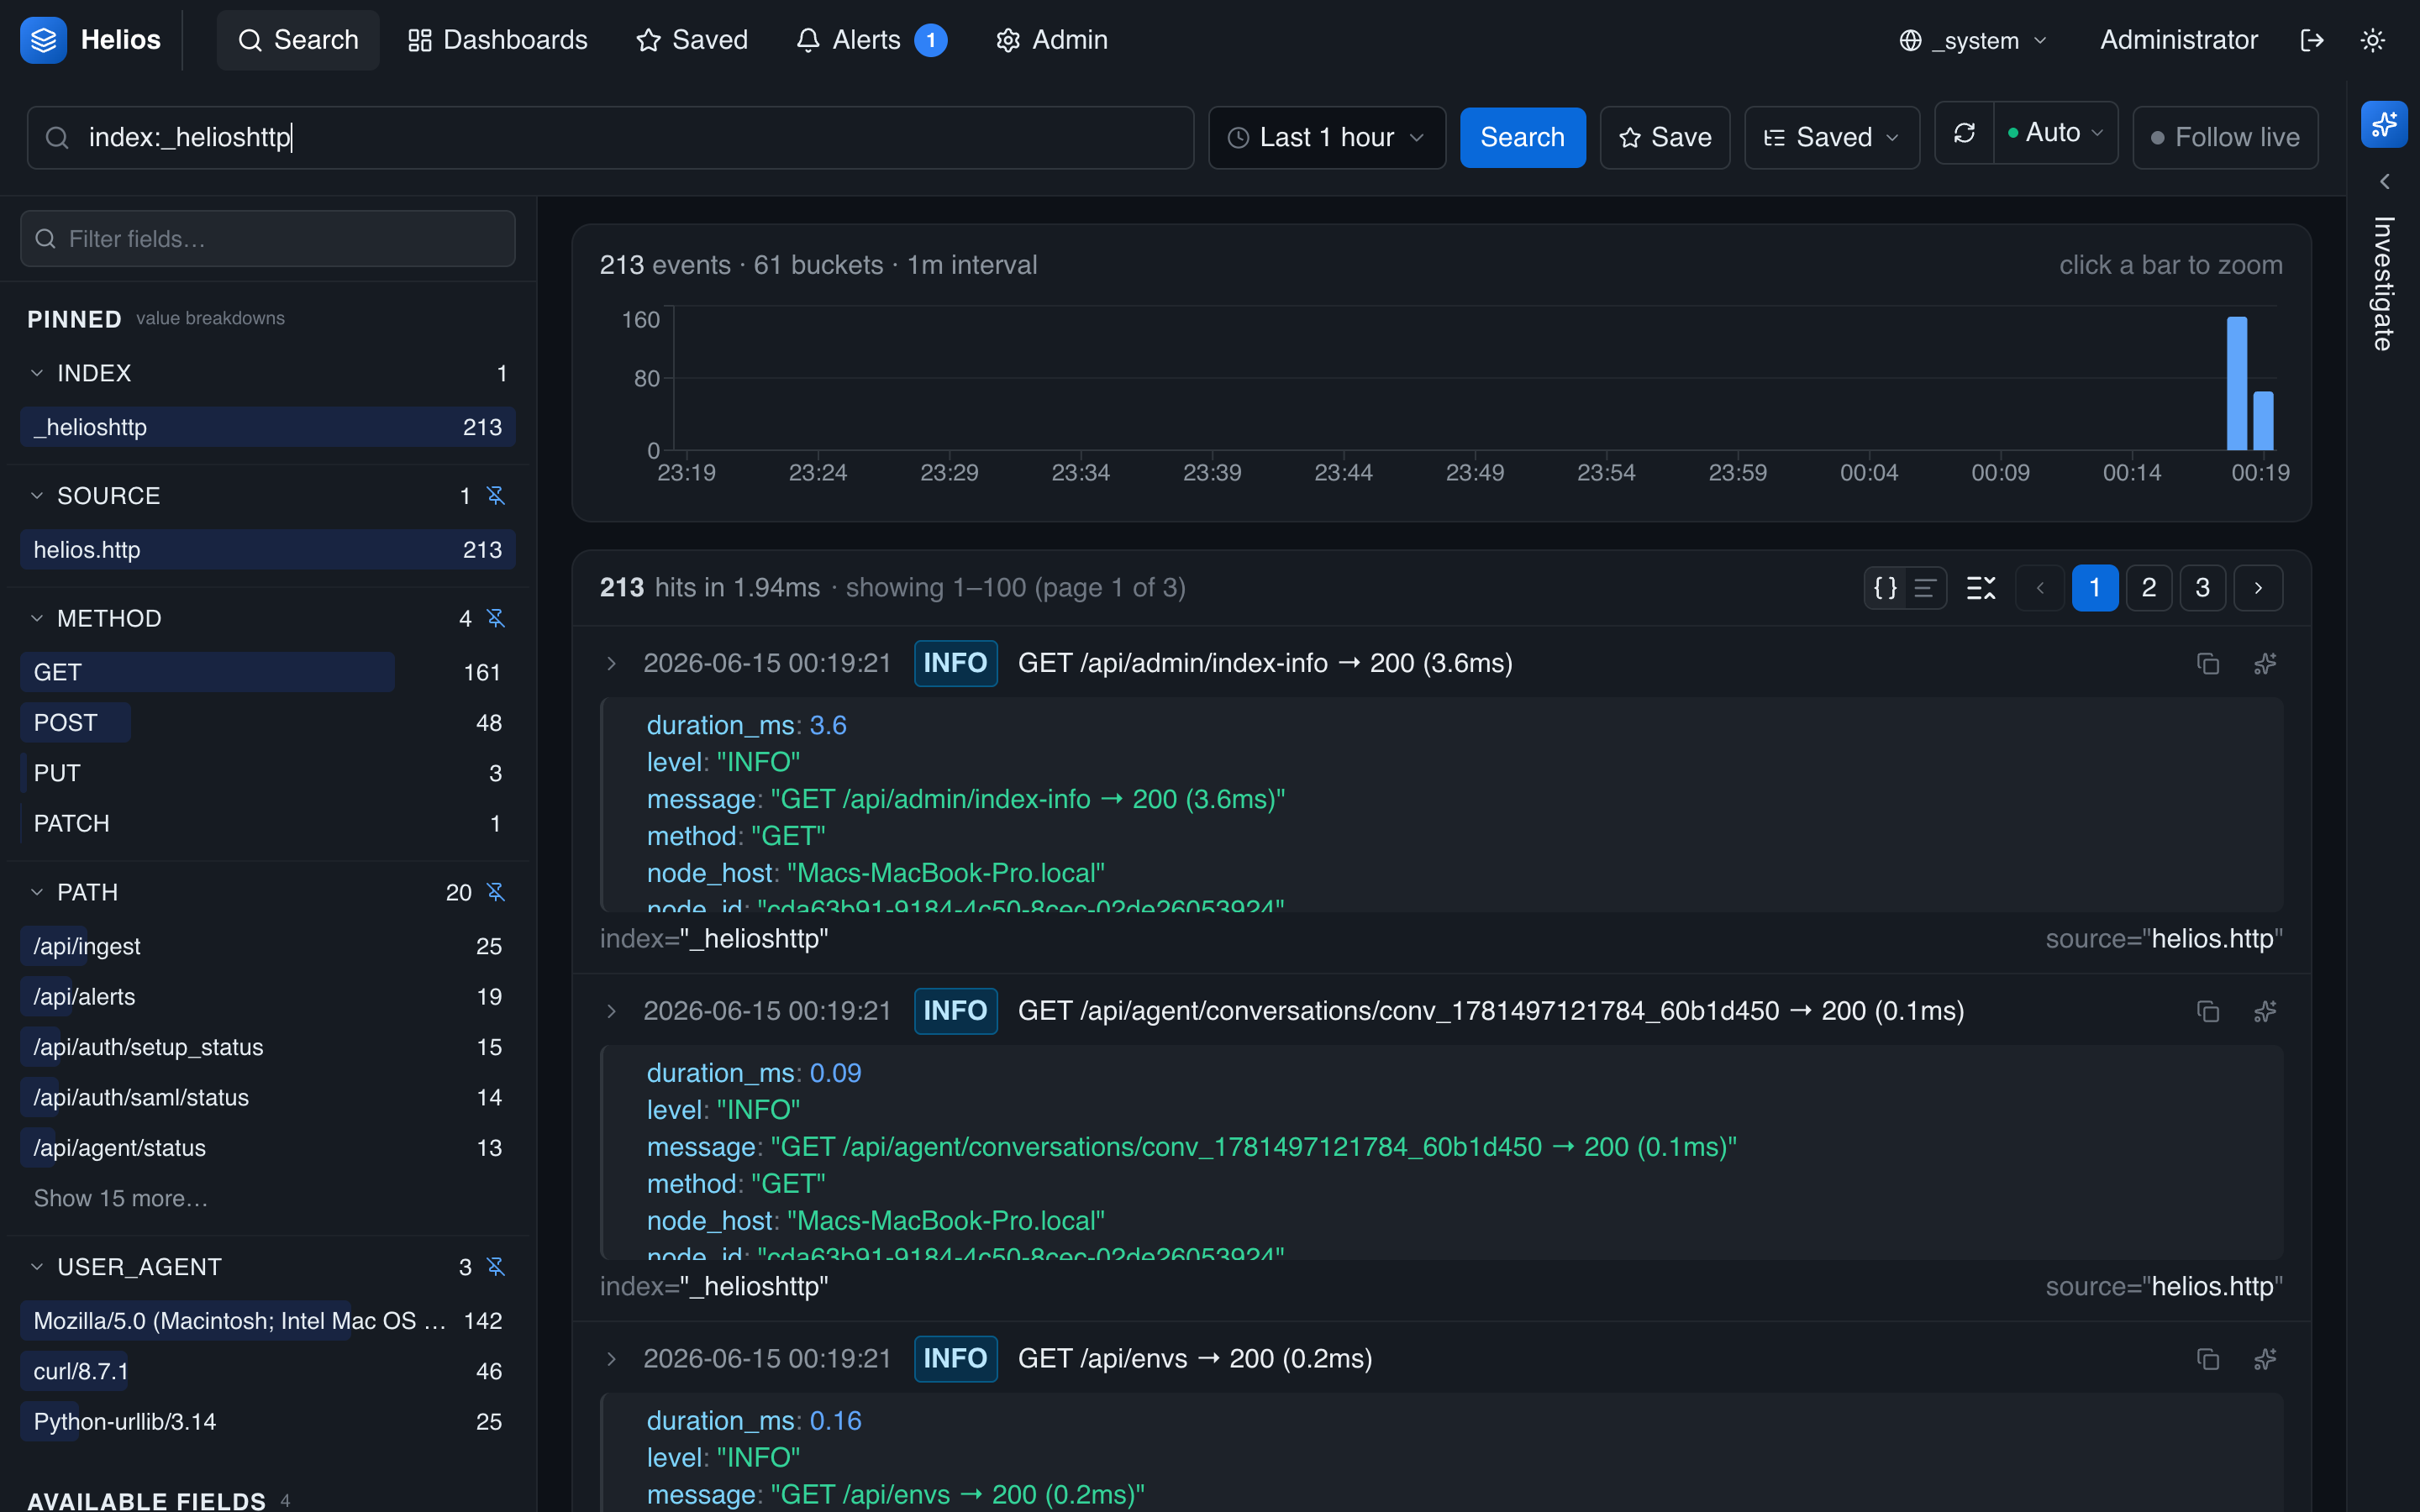
_helioshttp | HTTP access logs — method, path, status, latency, user. |
_heliosmcp | MCP tool calls — tool, status, duration, arguments. |
Querying them
Switch the environment picker to _system and search the index you want — it's the normal search experience, with the full query language and pipeline:
index:_helioshttp status:>=500 | timechart span=5m count
index:_helioslogs level:error
index:_heliosmcp status:error | stats count by tool
index:_helioshttp | stats p95(latency_ms) by path
Every self-log document is stamped with the node identity (id, host, port), so in a cluster you can attribute behavior to a specific instance.
What it's good for
- Performance — request latencies (
_helioshttp), slow paths, and the effect of a tuning change. - Errors — internal warnings/errors (
_helioslogs), failed webhook deliveries, SAML failures. - AI/MCP usage — what assistants are doing (
_heliosmcp) and how long tool calls take. - Ingest health — request rates and 429s on the ingest endpoints.