
Investigating with the agent
The agent is an in-app assistant that searches, aggregates, and charts your logs to answer questions and investigate incidents — in plain language. It opens in a drawer on the right of the app: the Investigate panel.
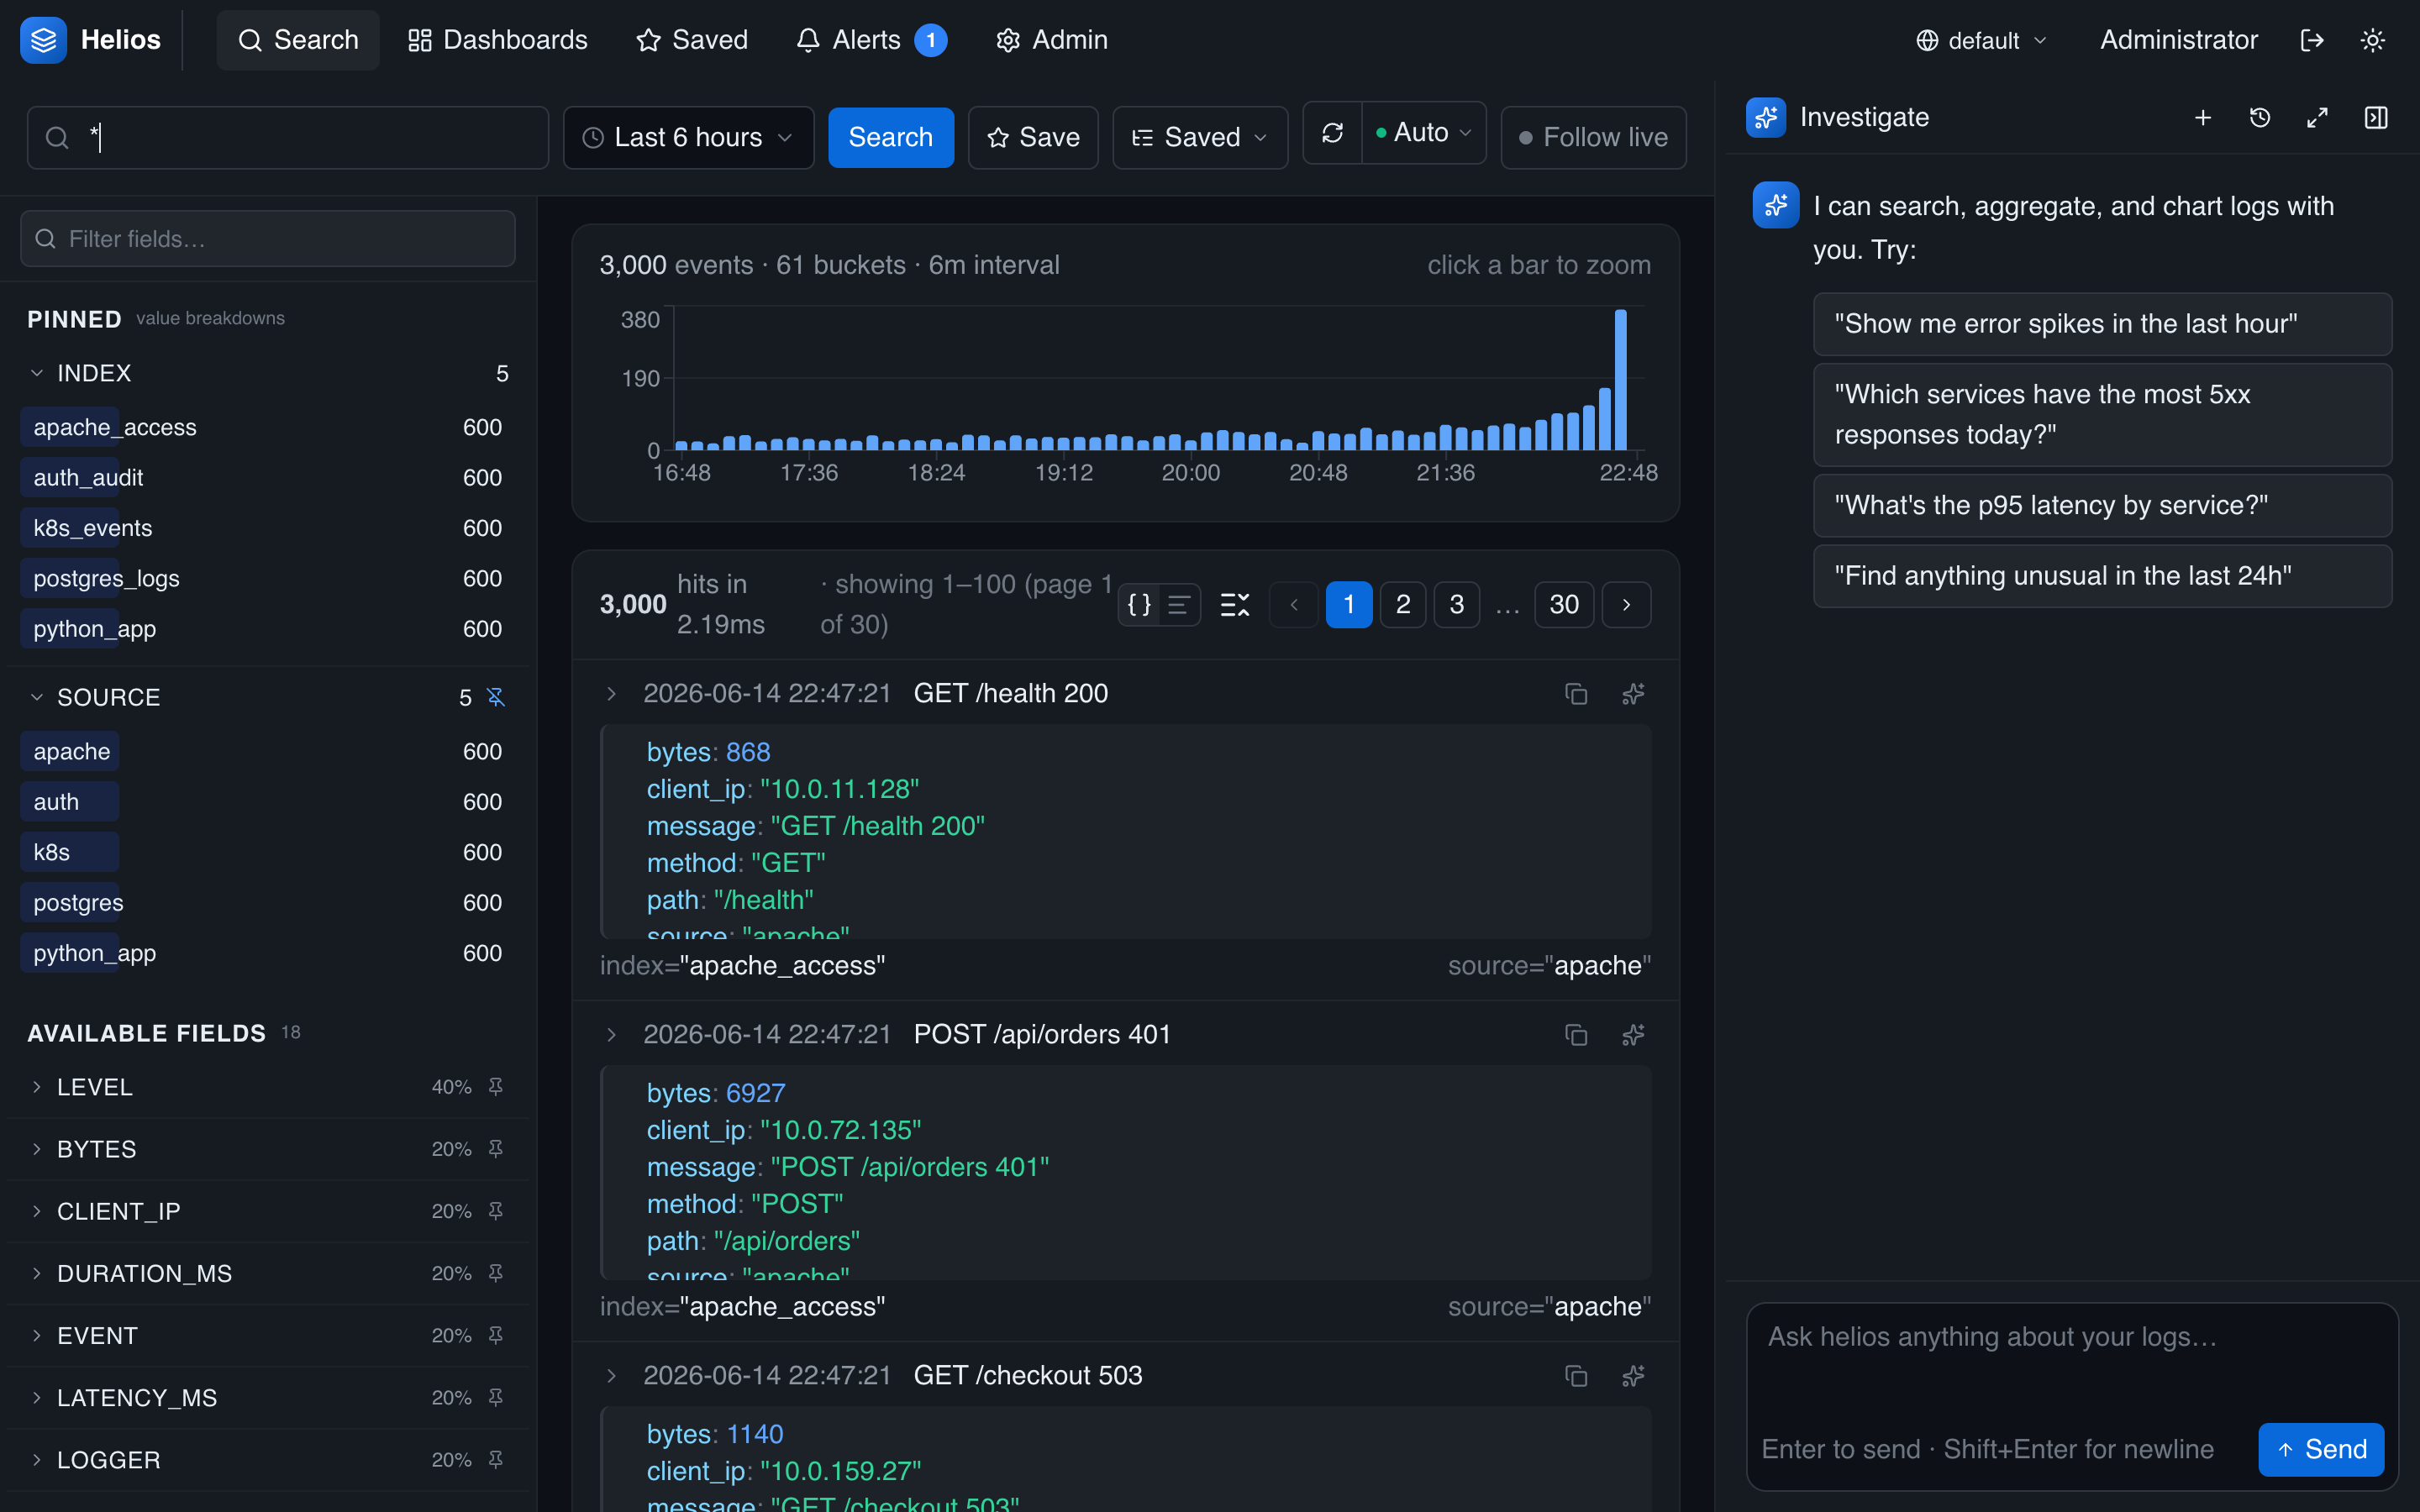
Requires a provider
The agent only appears once an admin has configured and enabled an LLM provider.
Conversations
Open the drawer and ask a question. You can keep multiple conversations, rename them, and delete them. Conversations follow you, not the environment — switching environments keeps your chat history — and they're stored server-side, so they survive reloads. Start a new one with the + button to keep investigations separate.
How it answers
As the agent works, it calls tools — search, histogram, aggregate, field discovery — and you see each call inline as an artifact: the tool, its arguments, and the result (a table, a chart, a field list). This makes its reasoning auditable: you can see exactly which queries it ran and what they returned, not just the conclusion.
What the agent can do
The agent works entirely through HeliosLogs's own APIs — the same toolset as the MCP server — scoped to your active environment and access rights. It can:
- Search & analyze — run any query, including pipe operators (
stats,timechart,top, …) for aggregations. - Visualize — render histograms and bar/line charts inline (see below).
- Discover — sample fields, list indexes, partitions, and environments, and read catalog stats, so it can orient itself in unfamiliar data.
- Create — build dashboards and AI monitors for you.
- Act on alerts — list and acknowledge alerts.
Because it's the same catalog, anything the agent does in the panel an external assistant can do over MCP.
Investigate a single log line
Every event in the search results carries a one-click investigate action — the spark icon revealed when you hover the row. Click it and the agent opens with that exact log line (and the events around it) already loaded, so you can dig into one specific error without writing a query.
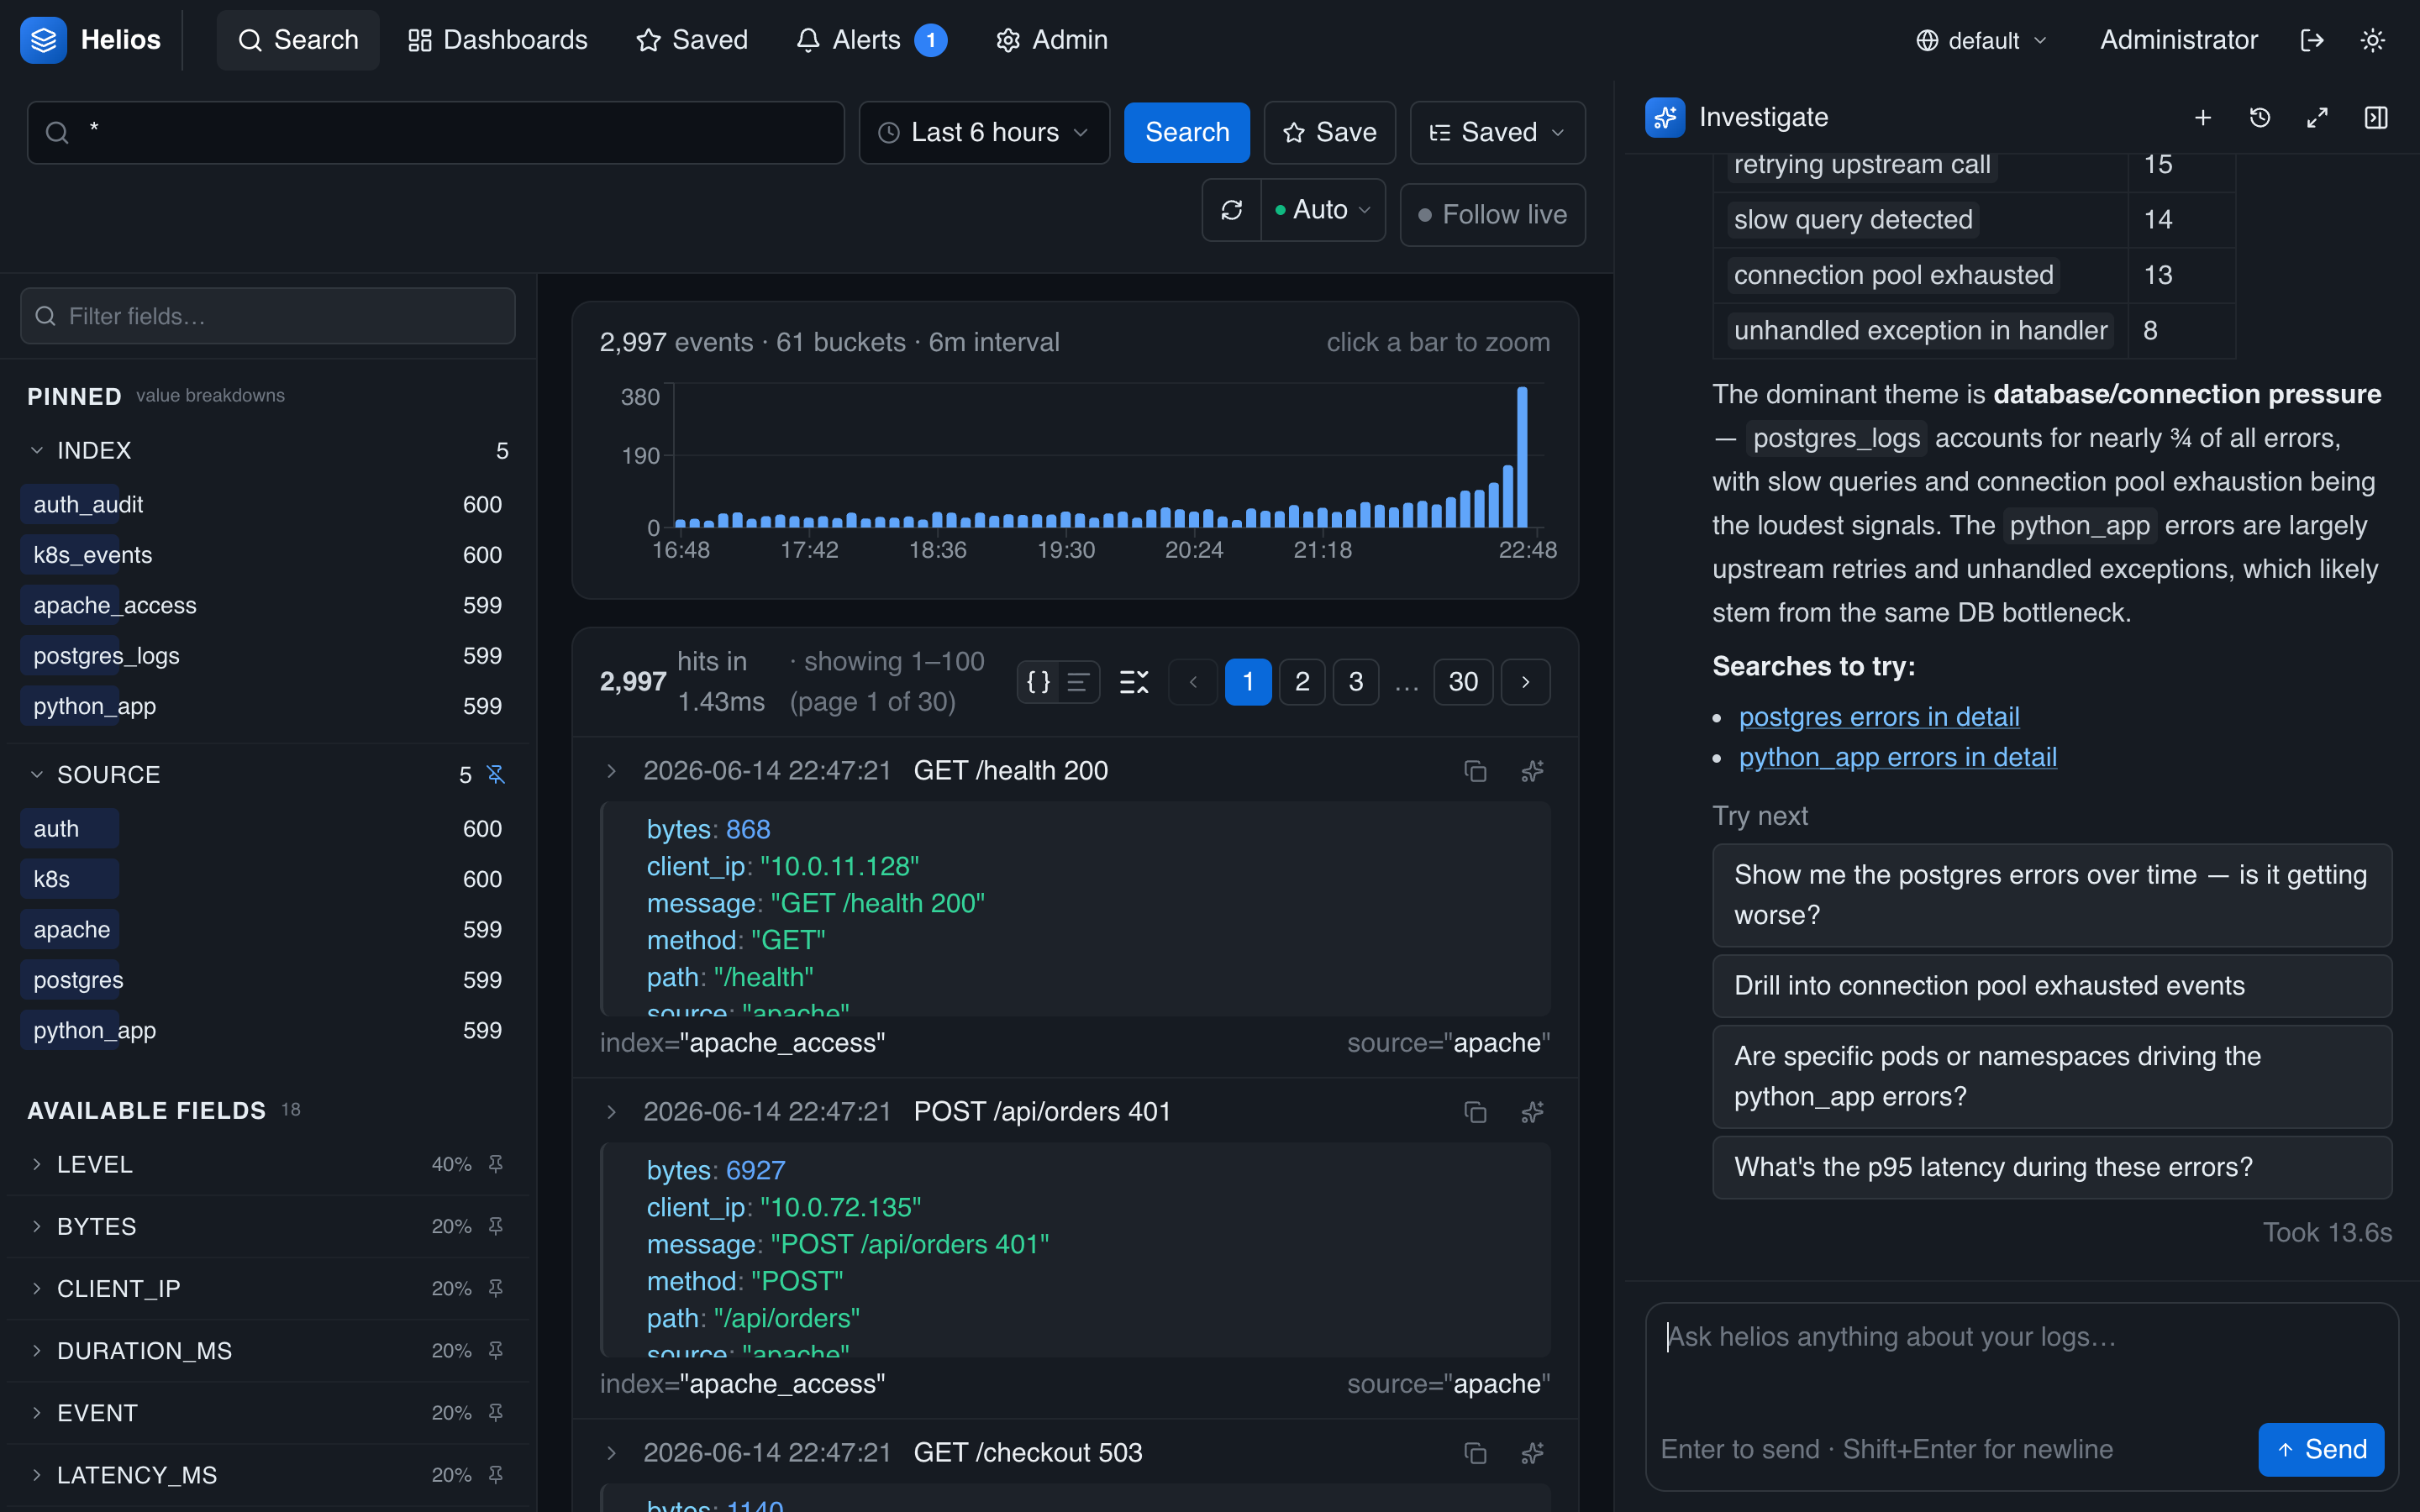
Example: investigating errors
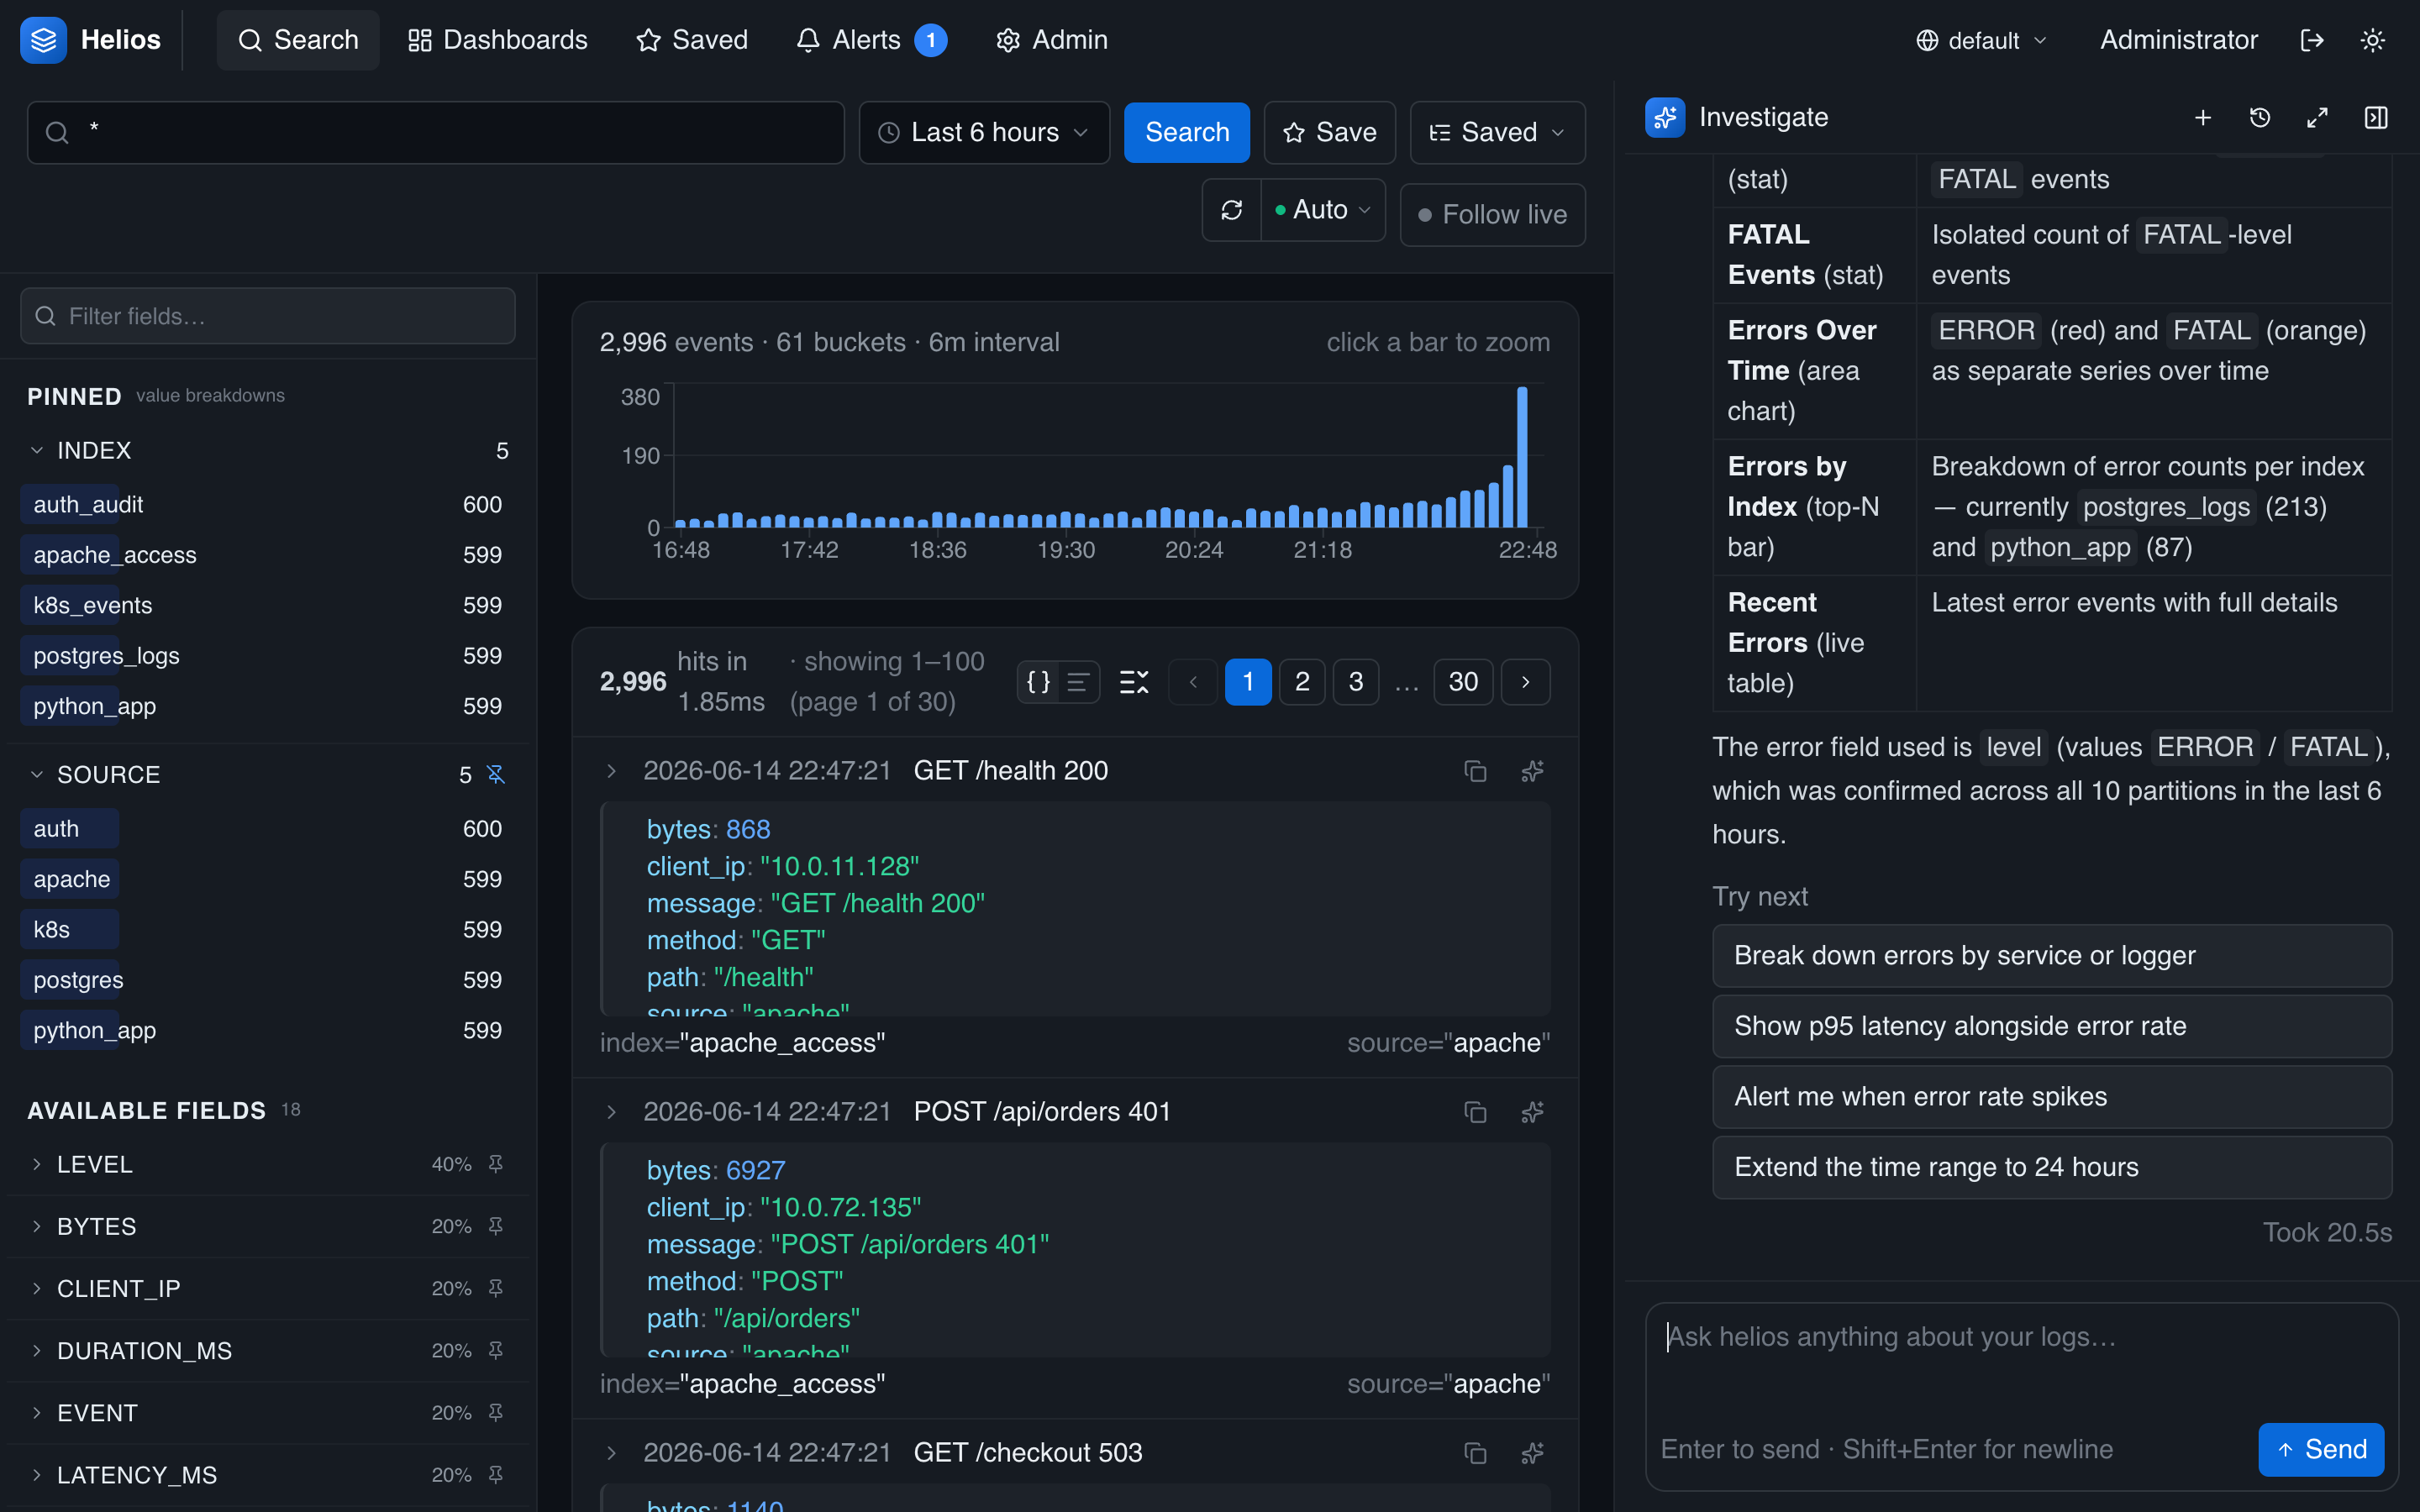
Ask about errors and the agent counts them, breaks them down by index/service, and surfaces the most common messages — then summarizes what it found.
Investigate the errors in the last 6 hours: how many are there, which indexes are they coming from, and what are the most common error messages?
Good error-investigation prompts:
- "Why did 5xx responses spike around 14:00? Which endpoints are affected?"
- "Find the root cause of the database timeout errors in the last hour."
- "Group today's errors by service and show the top error type for each."
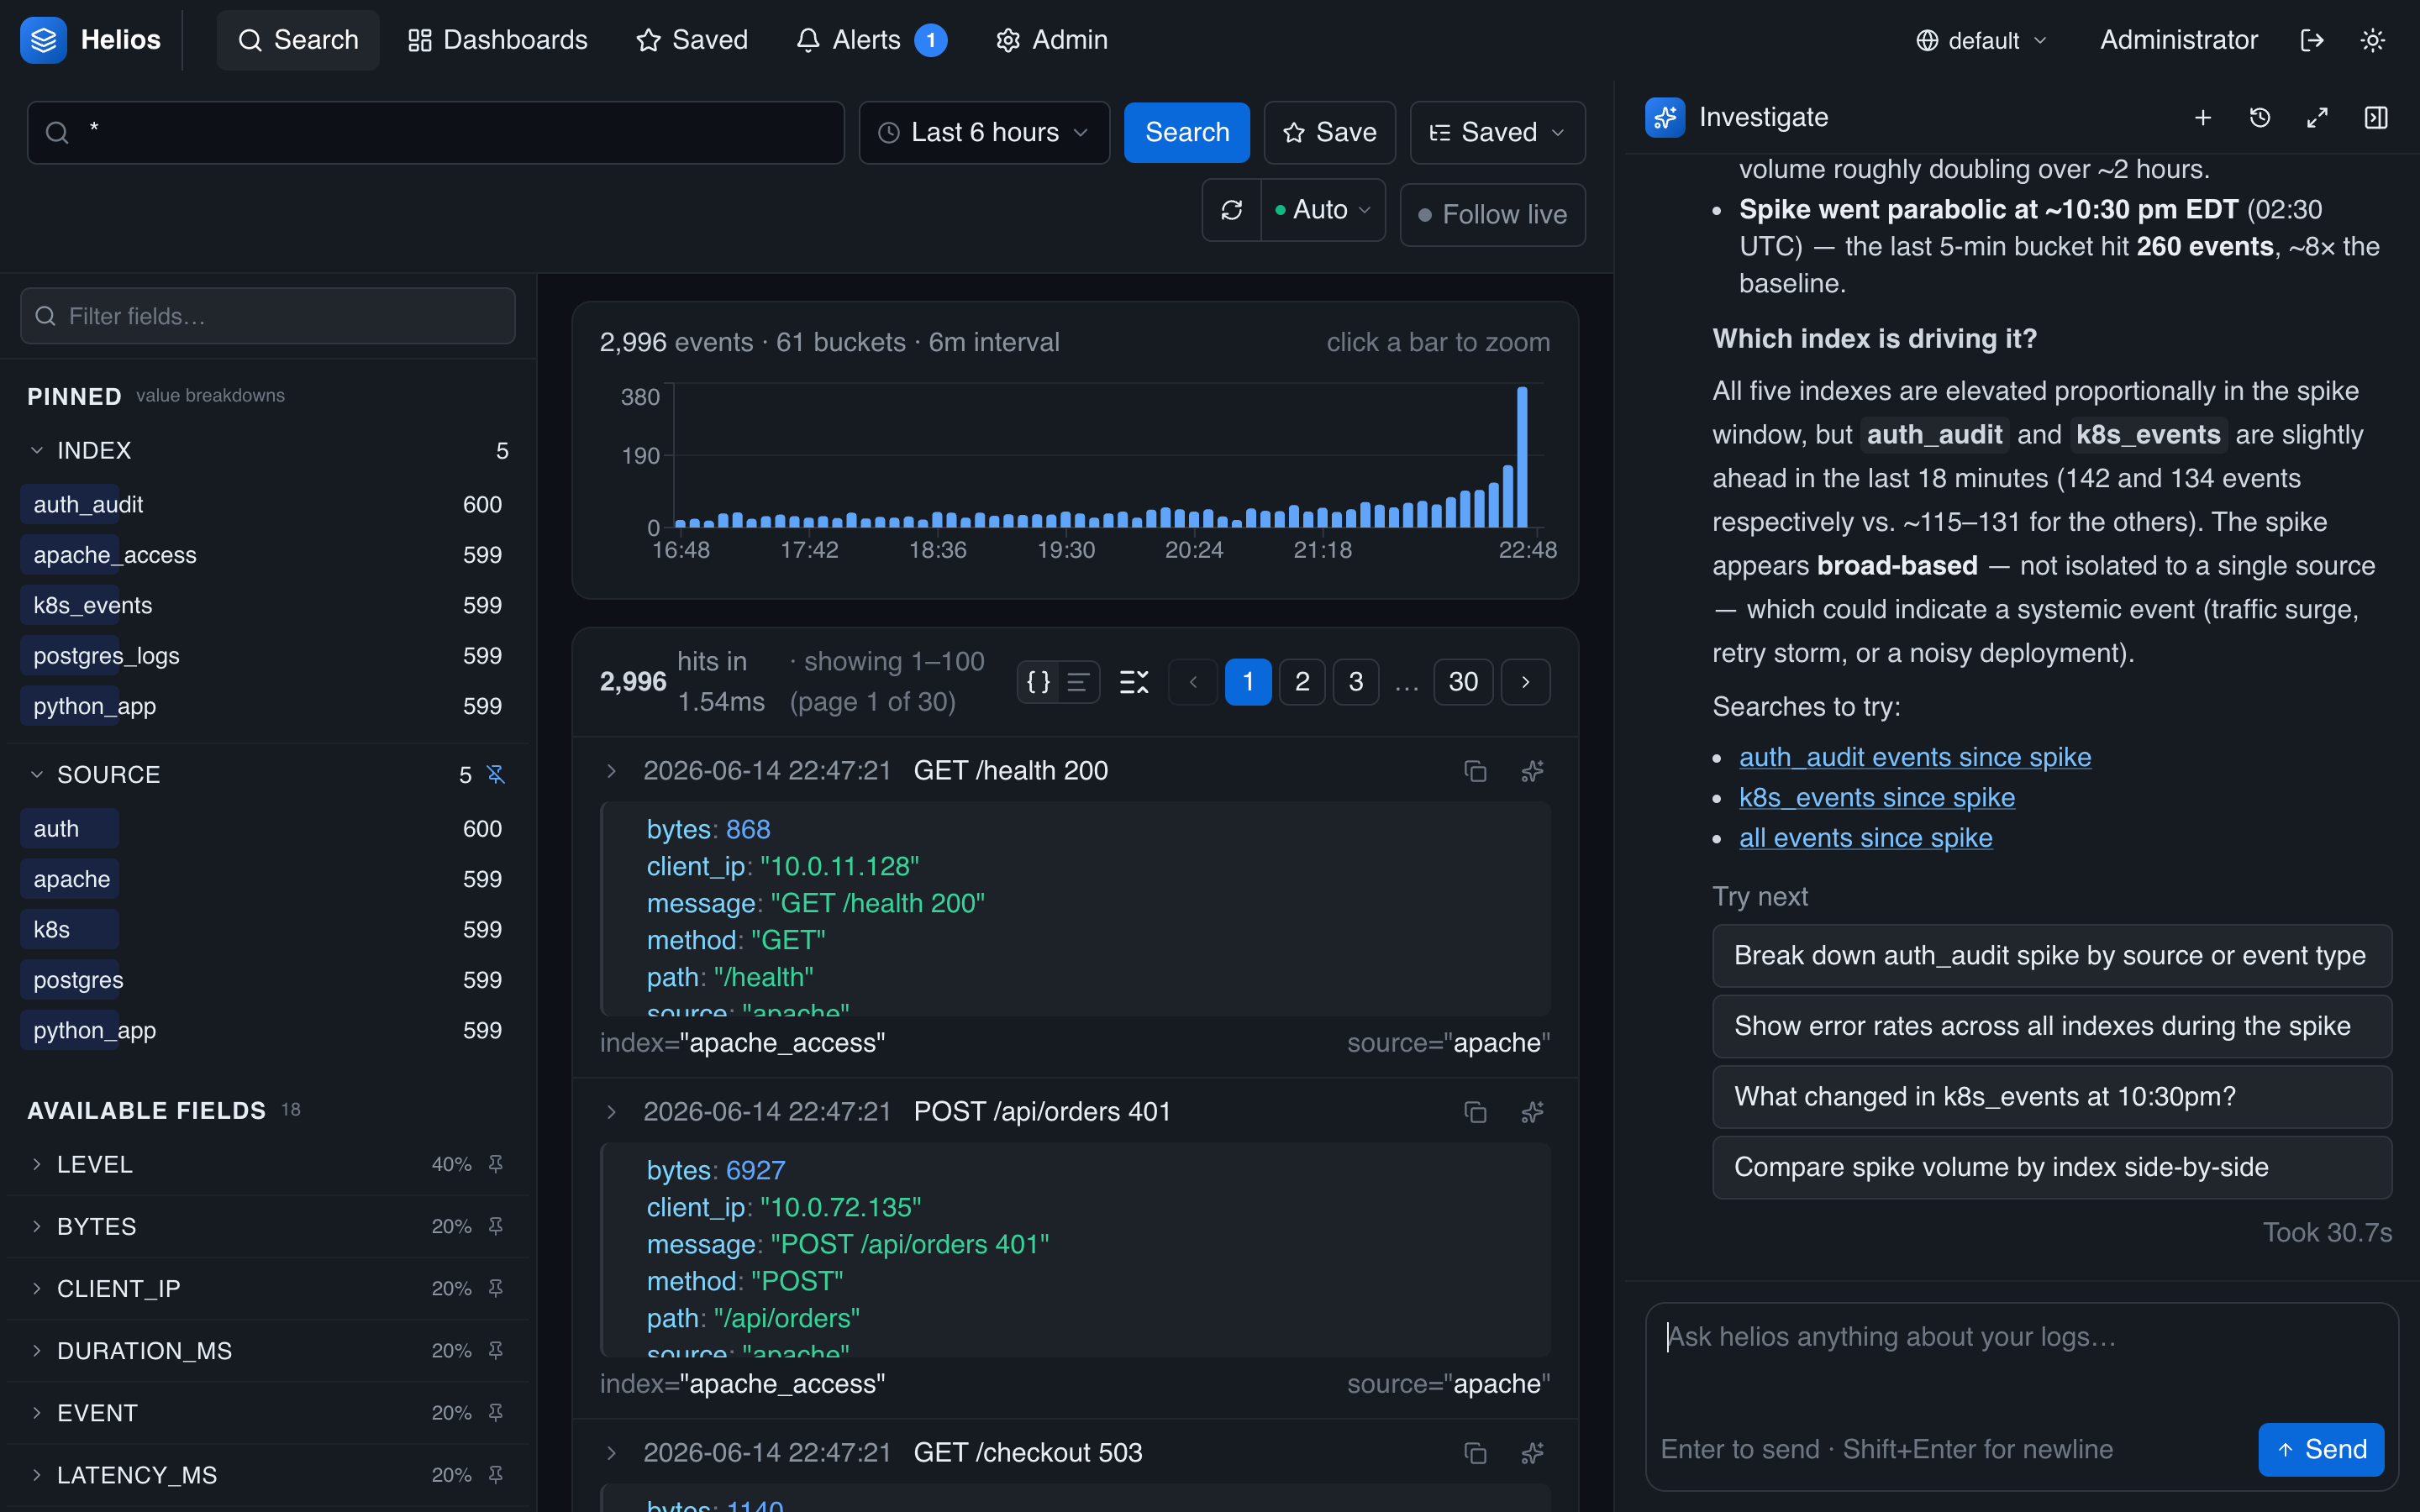
Example: spotting anomalies
The agent can compare time windows and pinpoint where unusual volume is coming from — useful when you don't yet know what to search for.
Is there an anomaly or spike in log volume in the last 6 hours? If so, when did it start and which index or source is driving it?
Good anomaly prompts:
- "Is there anything unusual in the logs over the last 24 hours?"
- "Compare error volume this hour to the previous hour — is it spiking?"
- "Which service has the most abnormal request volume right now?"
Visual answers (charts)
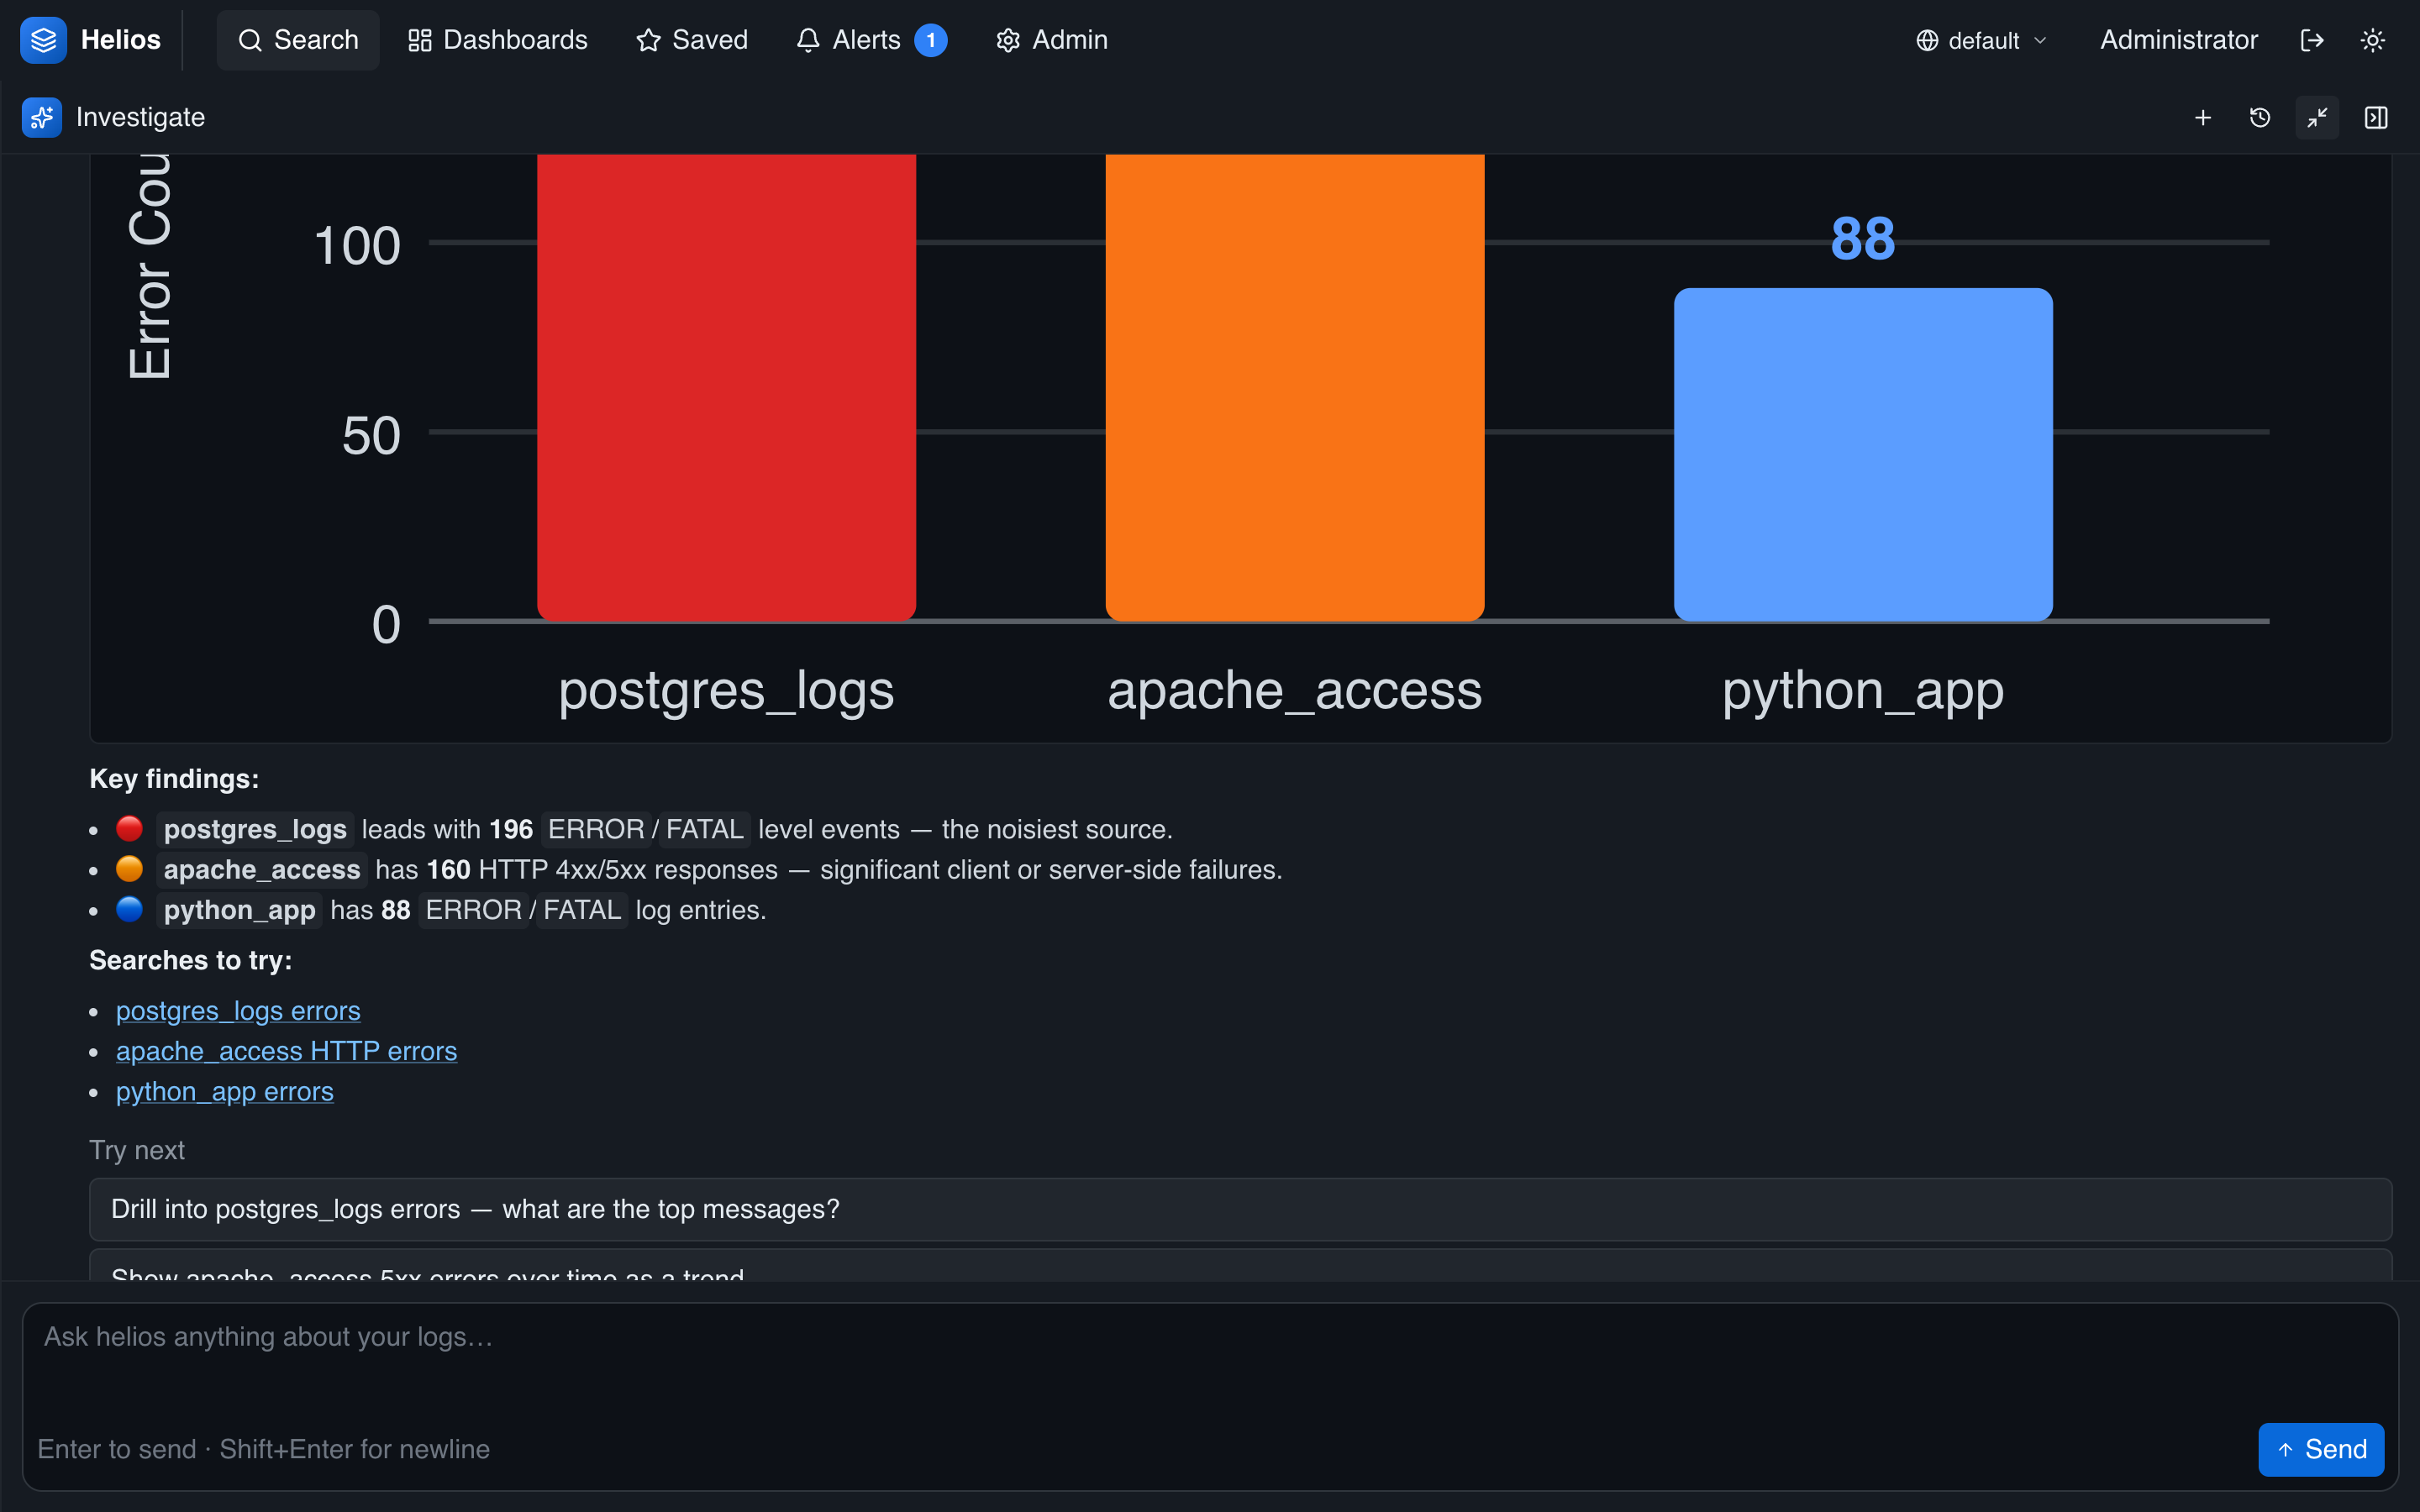
Ask for a chart and the agent renders one inline — a quick way to compare values across services, indexes, or status codes without leaving the conversation.
Which indexes have the most errors in the last 6 hours? Show me a bar chart.
More prompts that produce charts:
- "Show me p95 latency by service as a bar chart."
- "Chart request volume over time, split by status code."
- "Compare error rates across services and visualize it."
Build a dashboard with the agent
The agent can create, not just read. Ask it to build a dashboard and it assembles the widgets and saves it — then you open it from Dashboards.
Create a dashboard called "Error overview" with a time series of errors over time and a breakdown of errors by index.
Investigate from context
The fastest way in is to launch the agent with context already loaded:
- From a fired alert, click Investigate — the agent starts with the alert's query, window, and evidence.
- From the search page, the agent picks up your current query and time range, so "dig into these" works without retyping.
Prompt tips
- Give it a time frame — "in the last hour", "since 14:00". The agent also picks up the search page's active range.
- Name the dimension you care about — by service, by index, by status, by host.
- Ask for the format — "as a table", "show a chart", "just the top 5".
- Chain follow-ups — once it answers, drill in: "now show only the checkout service", "what changed compared to yesterday?".
Set up ongoing monitoring
Once you've found something worth watching, turn it into a recurring check. Ask the agent — "set up a monitor that alerts me whenever error volume spikes" — and it drafts and creates it, or build one yourself. See AI monitors, where the agent evaluates a natural-language prompt on a schedule and raises an alert when warranted.