
Widget reference
Each dashboard widget runs one or more queries and renders the result. From the dashboard editor you pick a widget type, give it a title, and configure its queries and options. Every widget can use the dashboard's time range or override it.
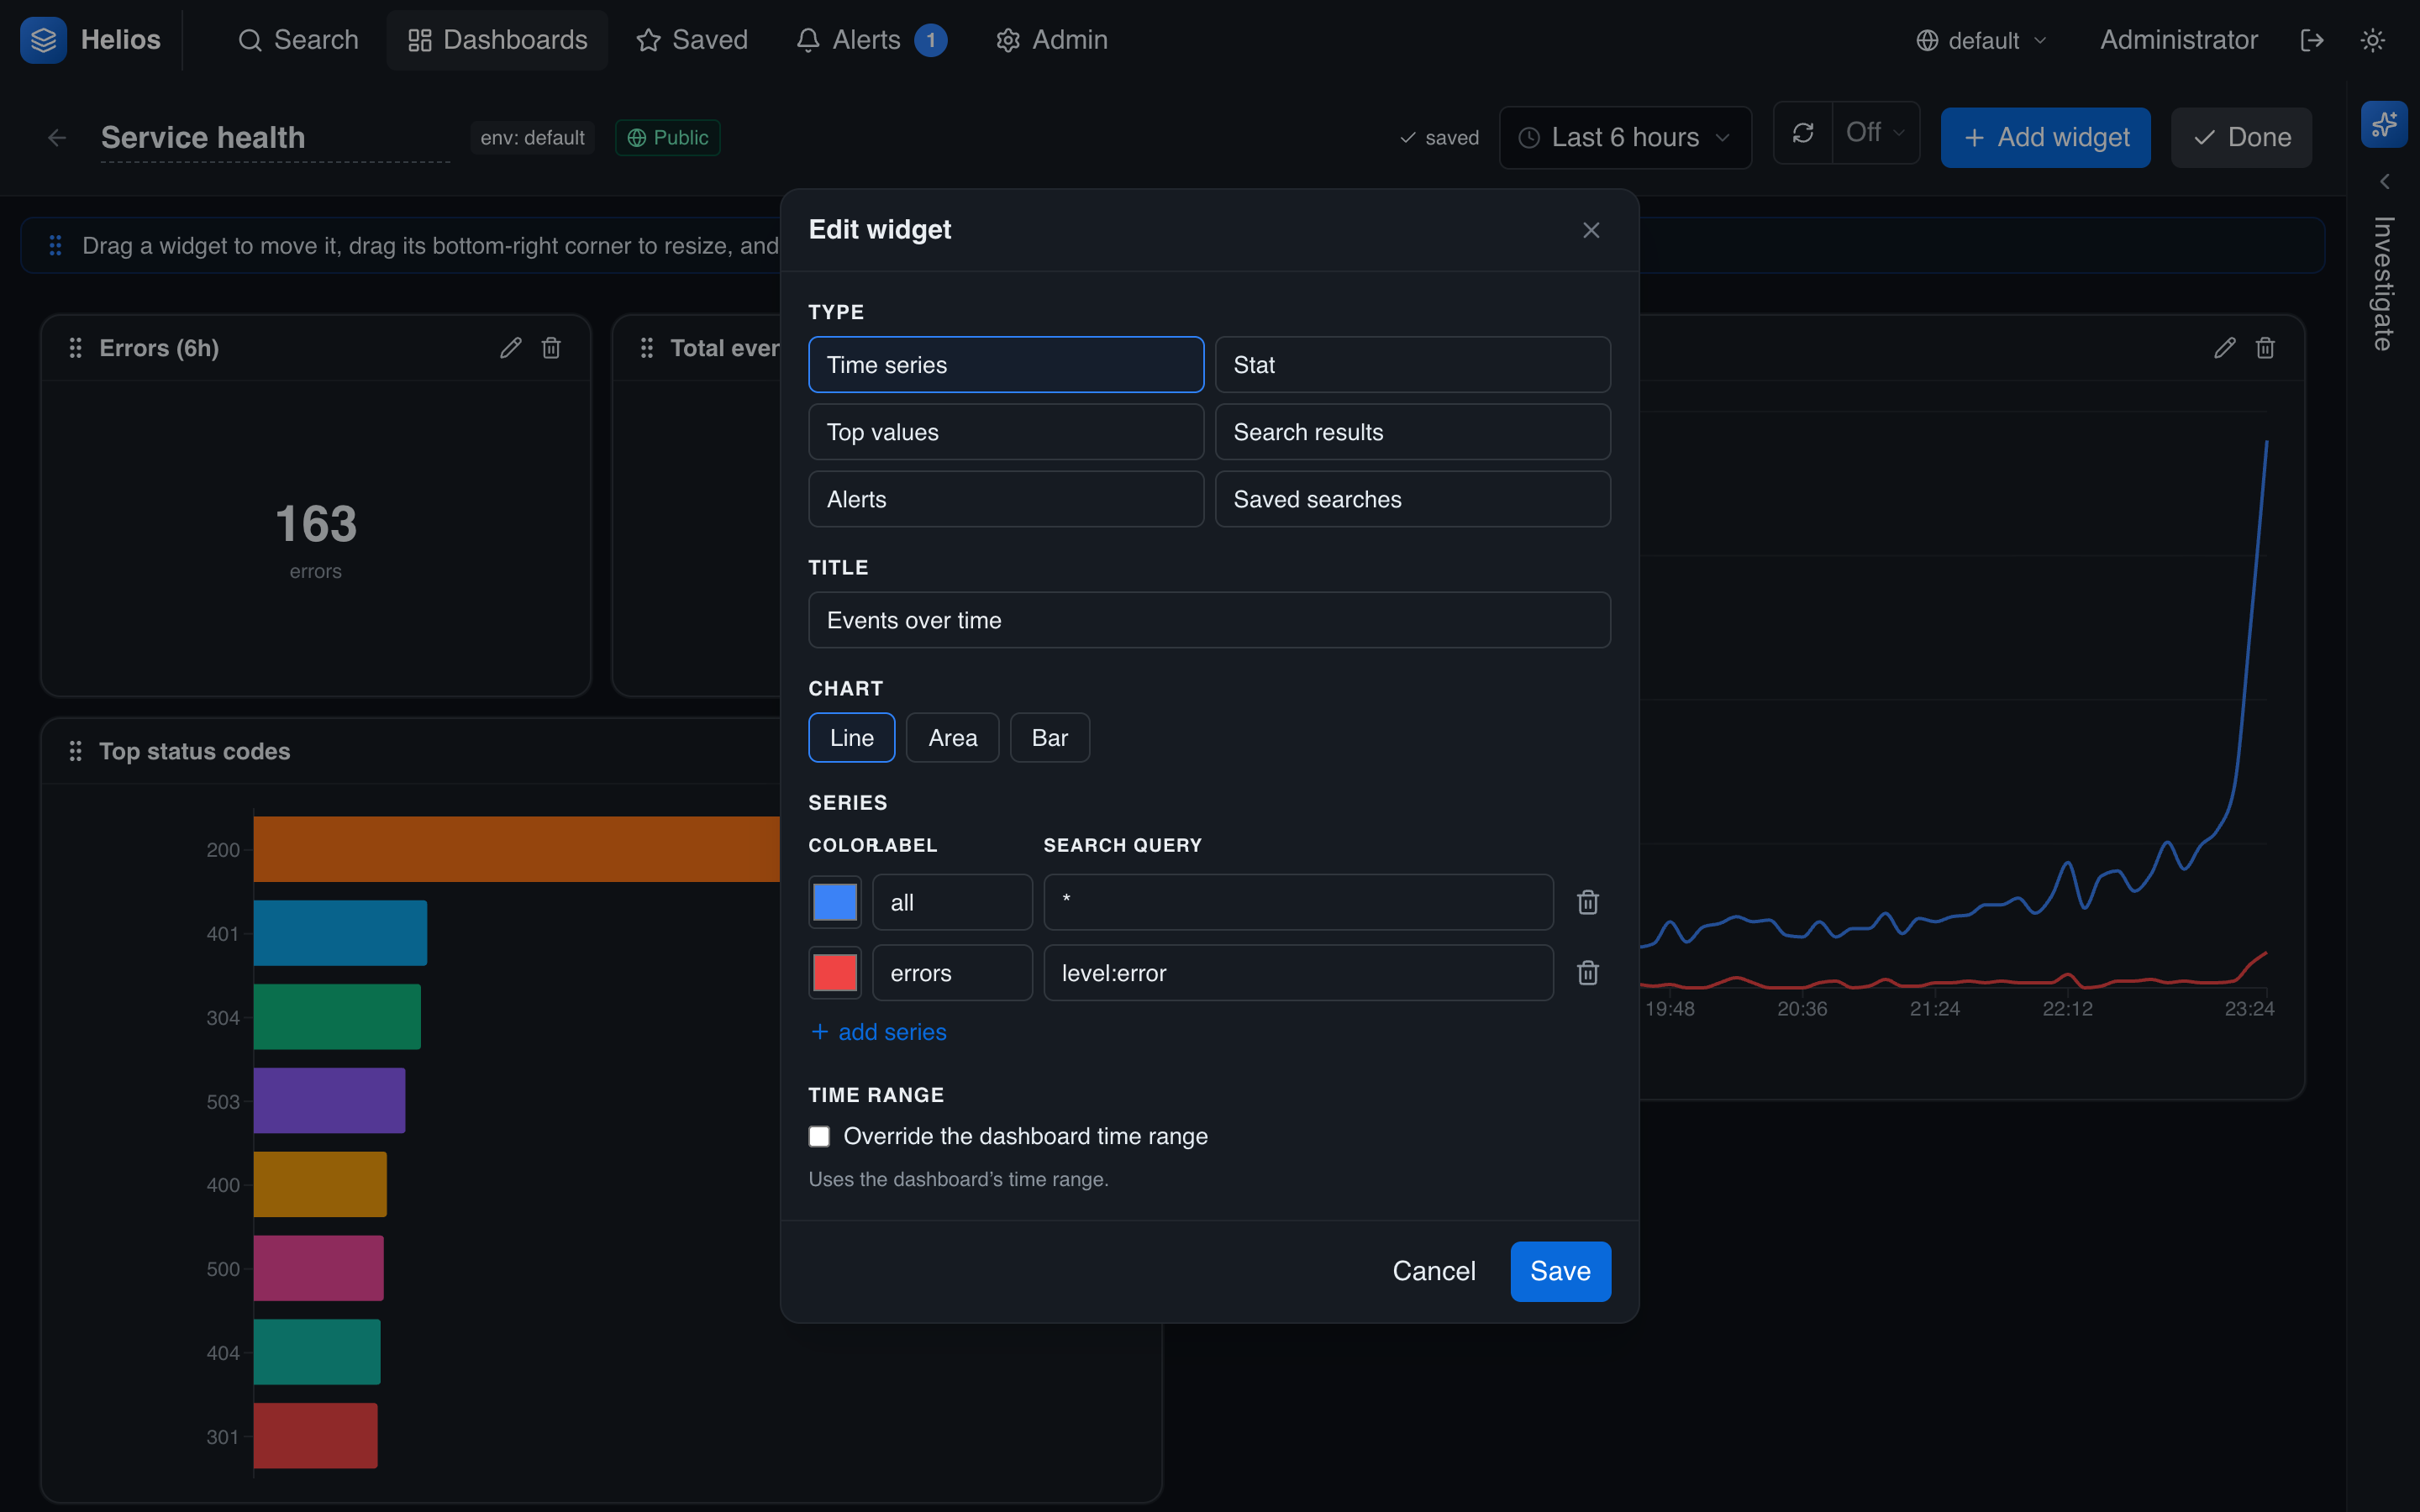
The editor's Type picker offers six widget kinds. The configuration fields below the picker change with the type you choose.
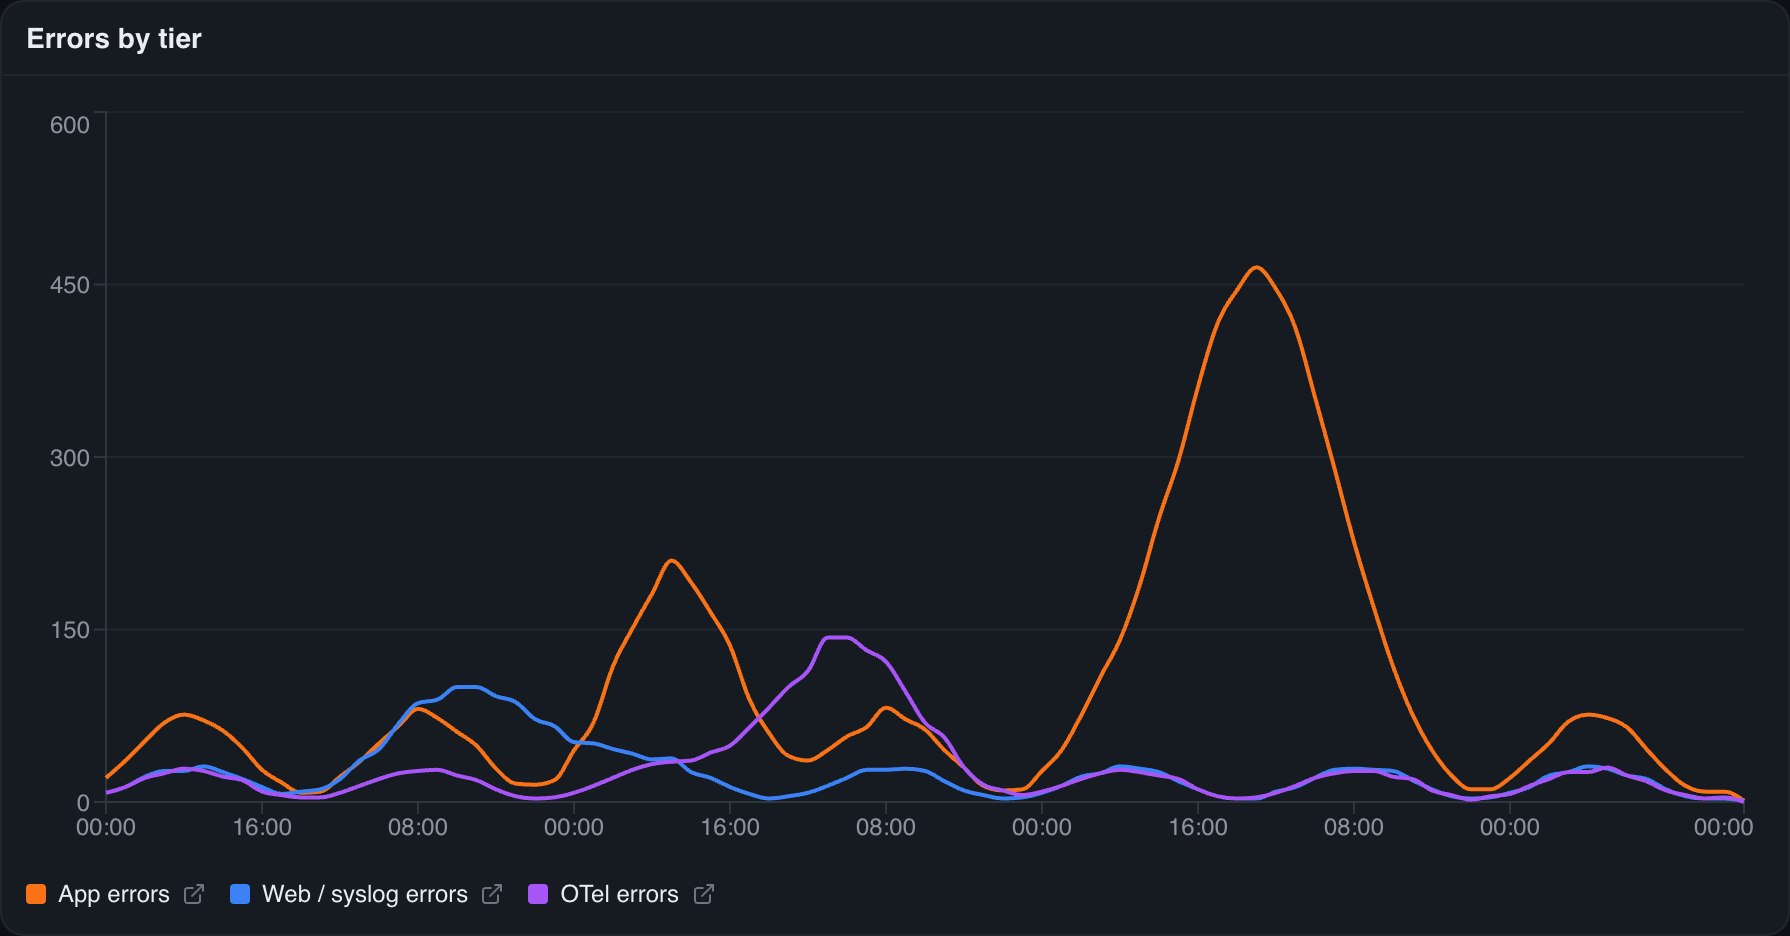
Time series
A line, area, or bar chart of match counts over time — one line per query series. Add several series (each its own query, with a label and color) to compare, e.g. requests vs. errors, or per-service volume. Good for trends and spotting anomalies.
Configure: chart kind (line / area / bar); one or more series, each a label, query, and color.
Stat
A single big number — the total matches for a query. Use it for headline metrics: error count, request total, count of a specific condition. Add multiple metrics to show a few numbers side by side, each with its own label and color.
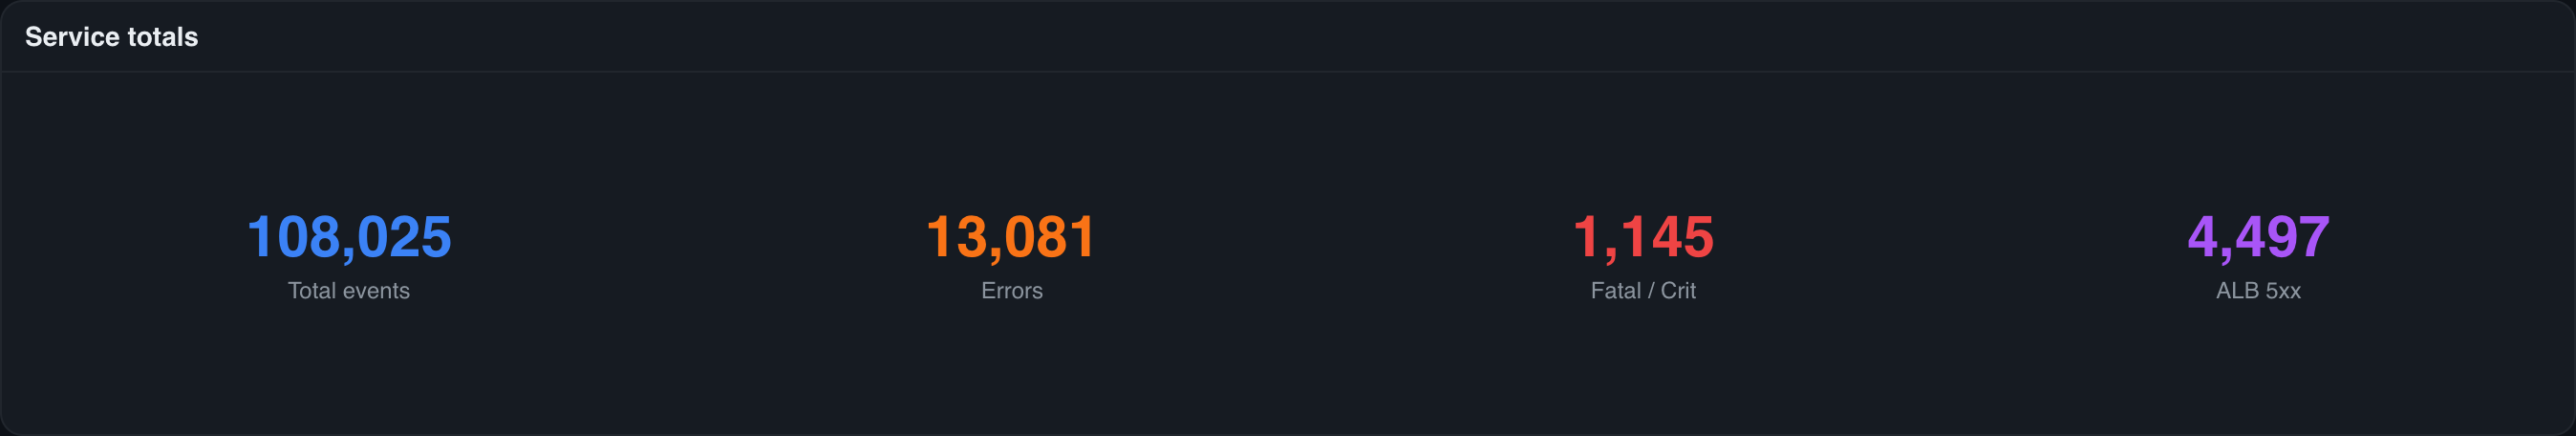
Configure: one or more metric series, each with a label, query, and color.
Top values
A breakdown of a field's most frequent values as a horizontal bar chart — "top status codes," "top services by error count," "slowest endpoints." It runs a terms aggregation over the base query.
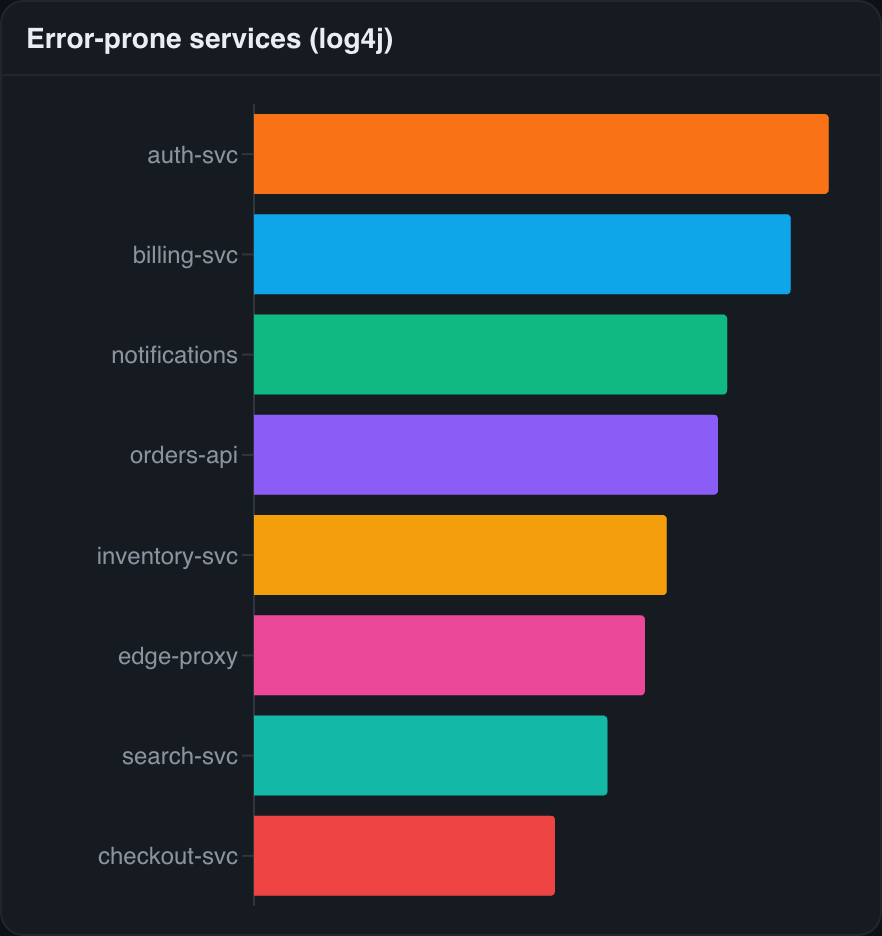
Configure: a base search query, the field to break down by, and Top N (how many values to show).
Search results
A table of the latest events matching a query — a live feed of, say, recent errors, embedded in the dashboard. A control in the title bar switches the display between table and raw views, and the widget links out to the full search page.
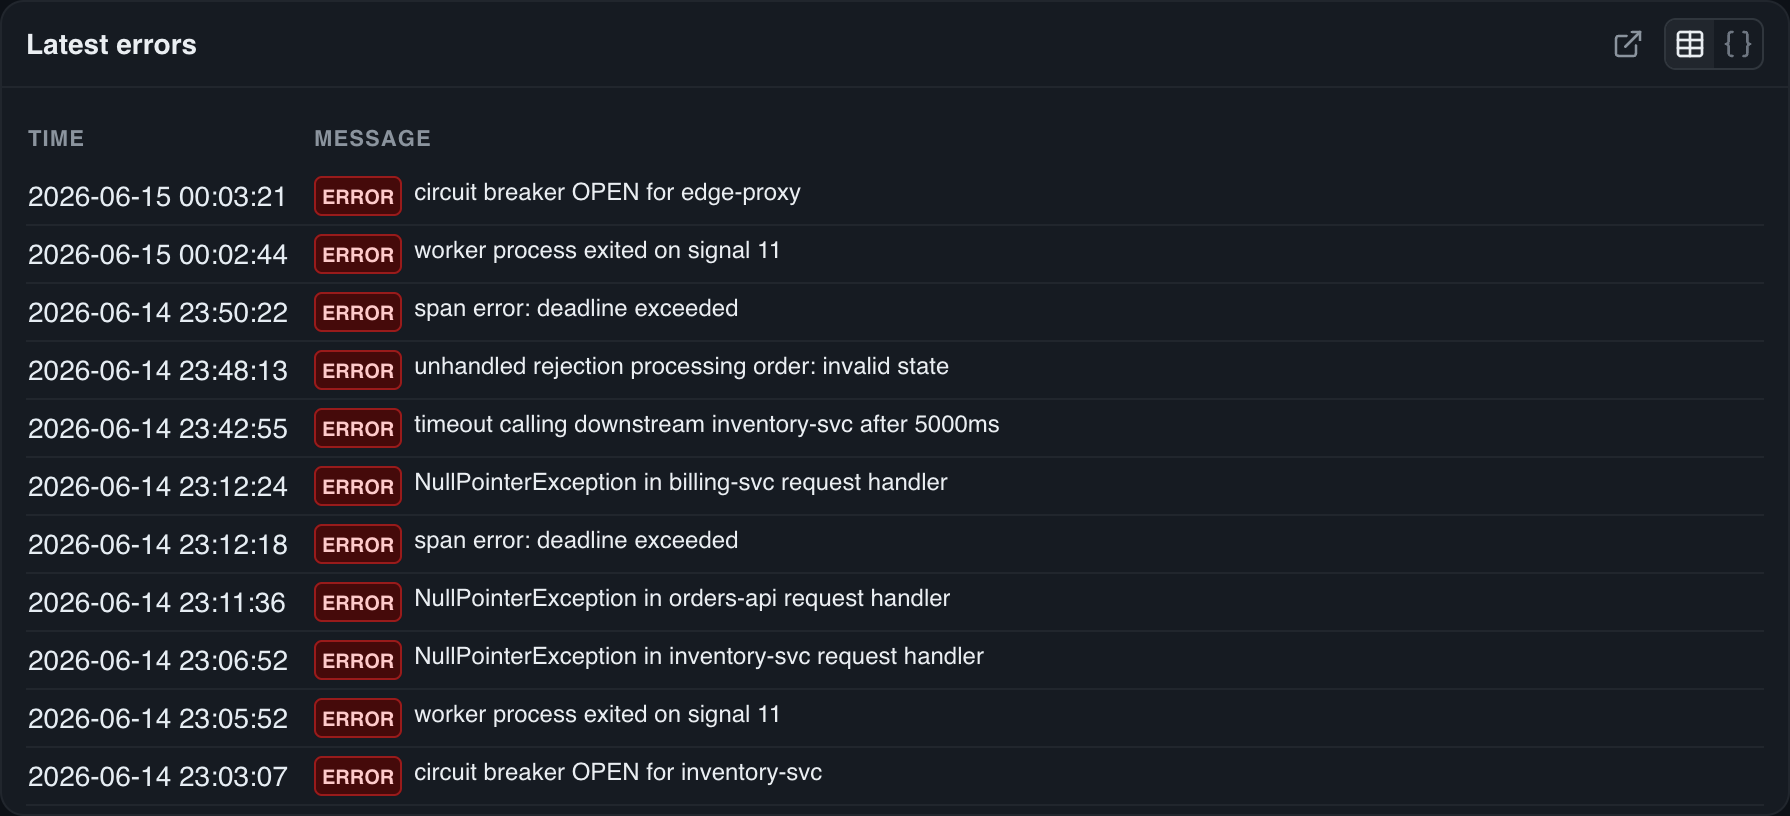
Configure: a base search query and max rows to show.
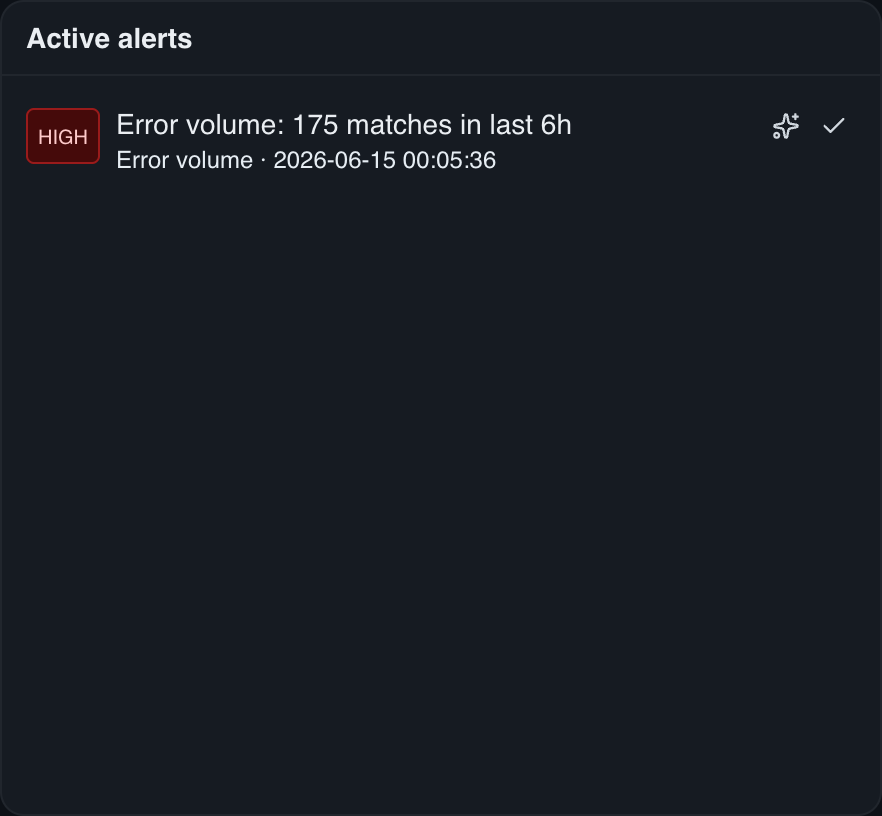
Alerts
Your alerts inbox embedded in the dashboard — fired alerts with their severity, and acknowledge / investigate actions inline. Handy for an ops/NOC board.
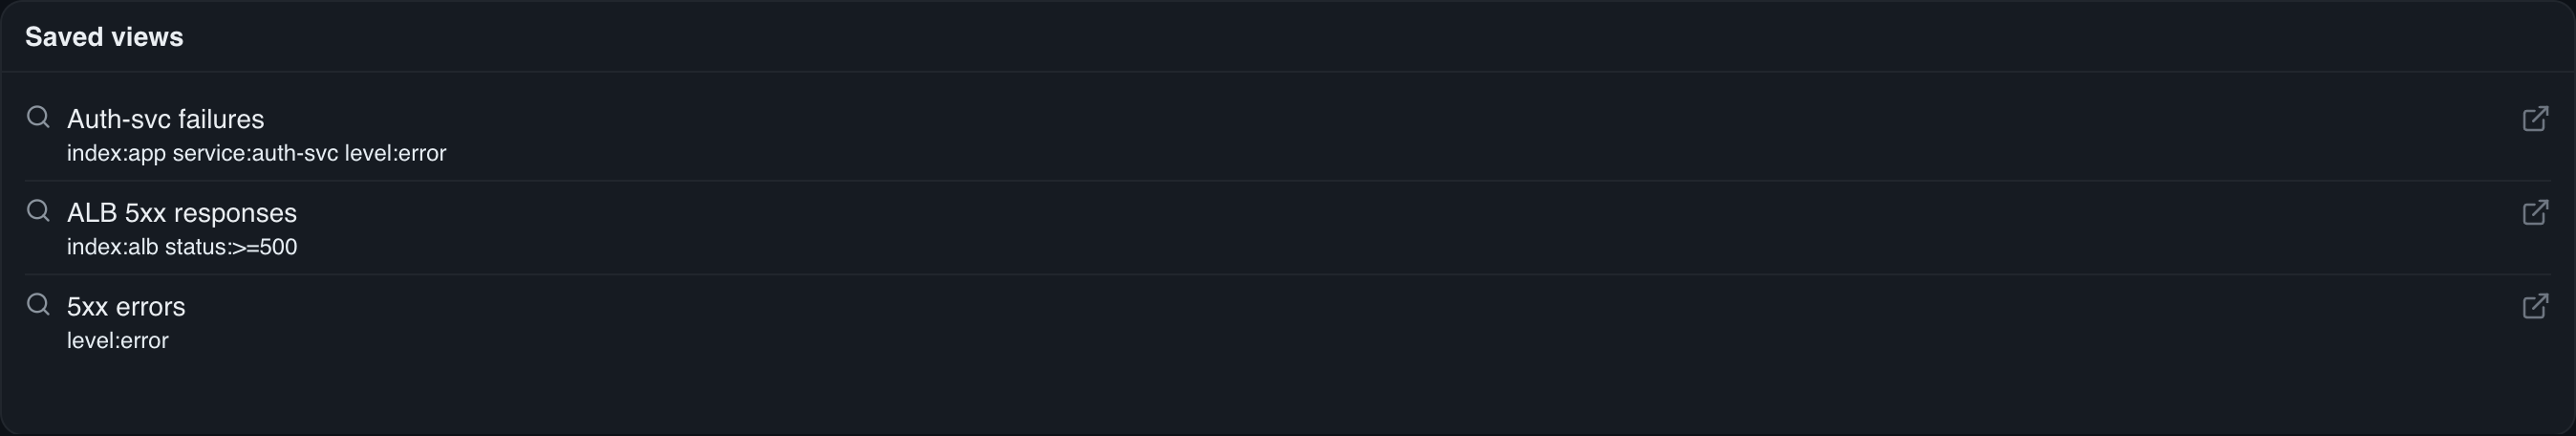
Saved searches
Shortcut tiles to your saved searches for one-click navigation from a dashboard into the search page.
Per-widget time range
By default a widget uses the dashboard's time range. Tick Override the dashboard time range in the editor to give one widget its own window — for example a 7-day trend panel sitting beside hourly ones.
Drill down
Most widgets link back to the full search page with their query and time range — so a dashboard is a launch point for investigation, not a dead end.